
Points display style
You can choose between point markers or circles to display on your map (a global setting). The default is markers. However, for datasets with over 500 points, the map will automatically switch to circles for faster loading and better performance.
If you select circles, you also have an option for clustering them, which is useful if you have a great many points overlapping each other.
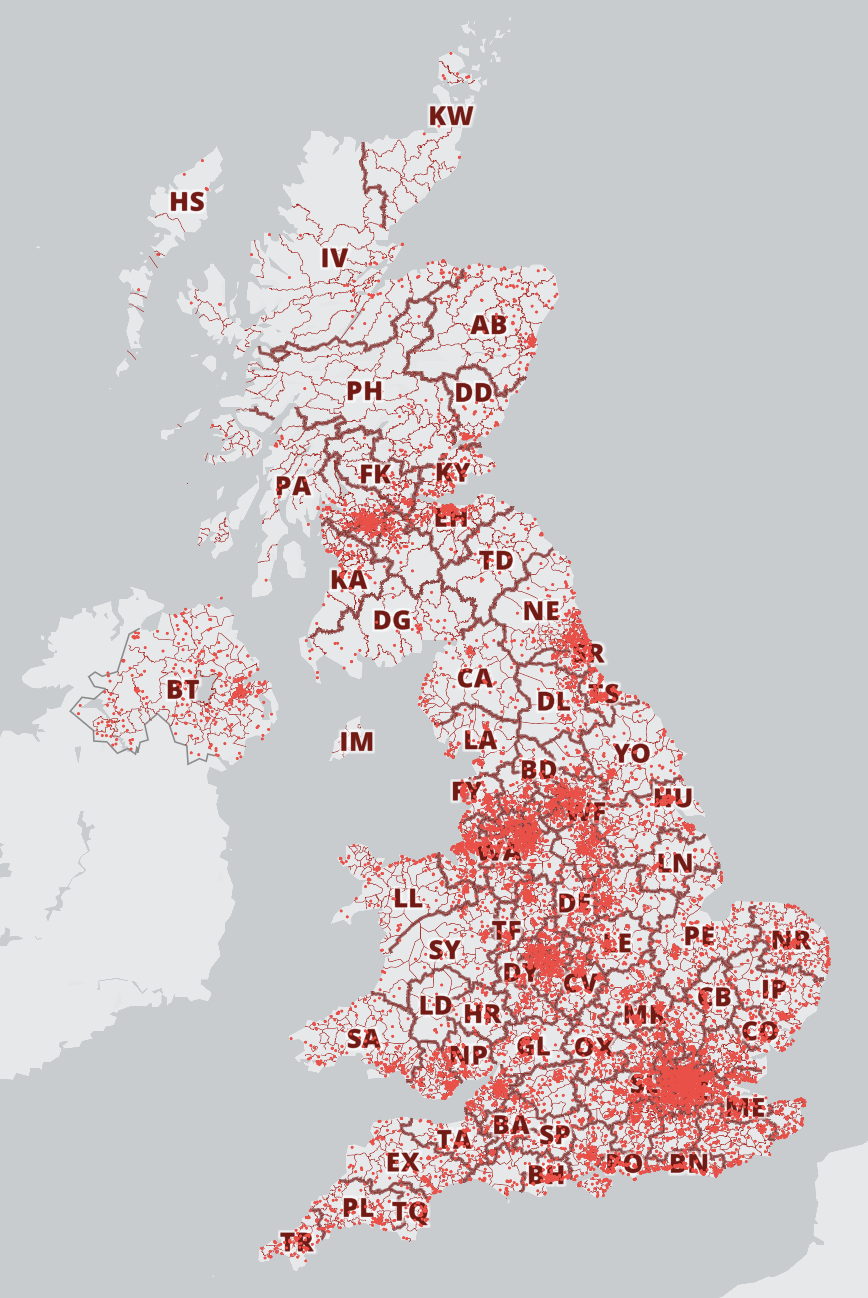
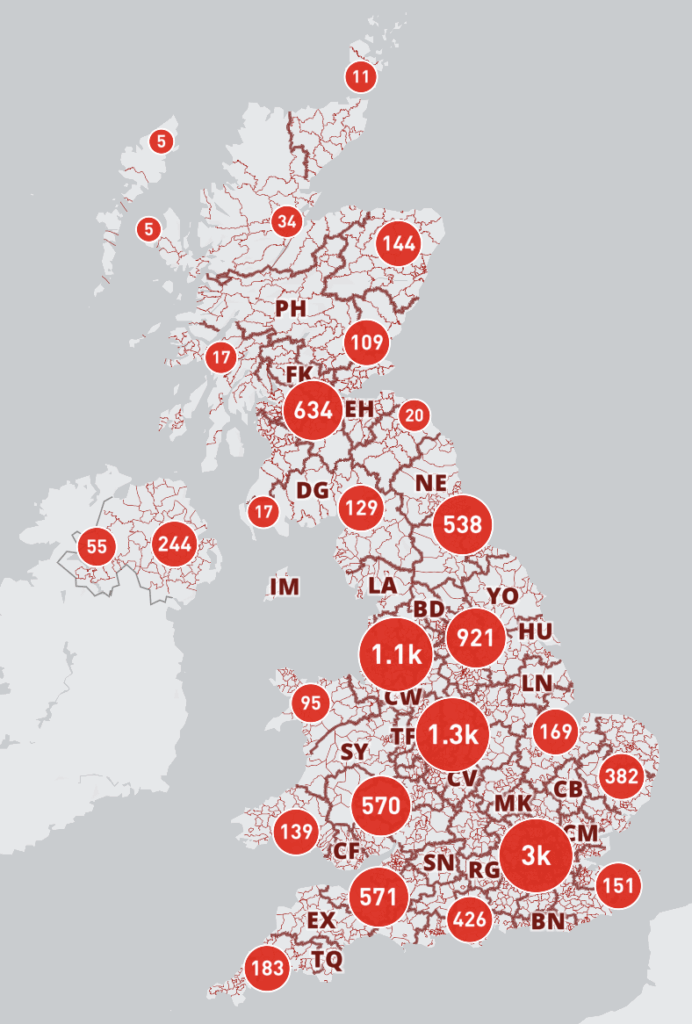
There are also controls for the size of markers, and circle size and border width if you are not clustering.
Please contact us if you want to use custom icons on your map.
Popup Trigger
The default is for popups to open only when a map location is clicked (or touched on a mobile device). However, you can switch the popup to open on mouse hover rather than click.
Population and household calculations
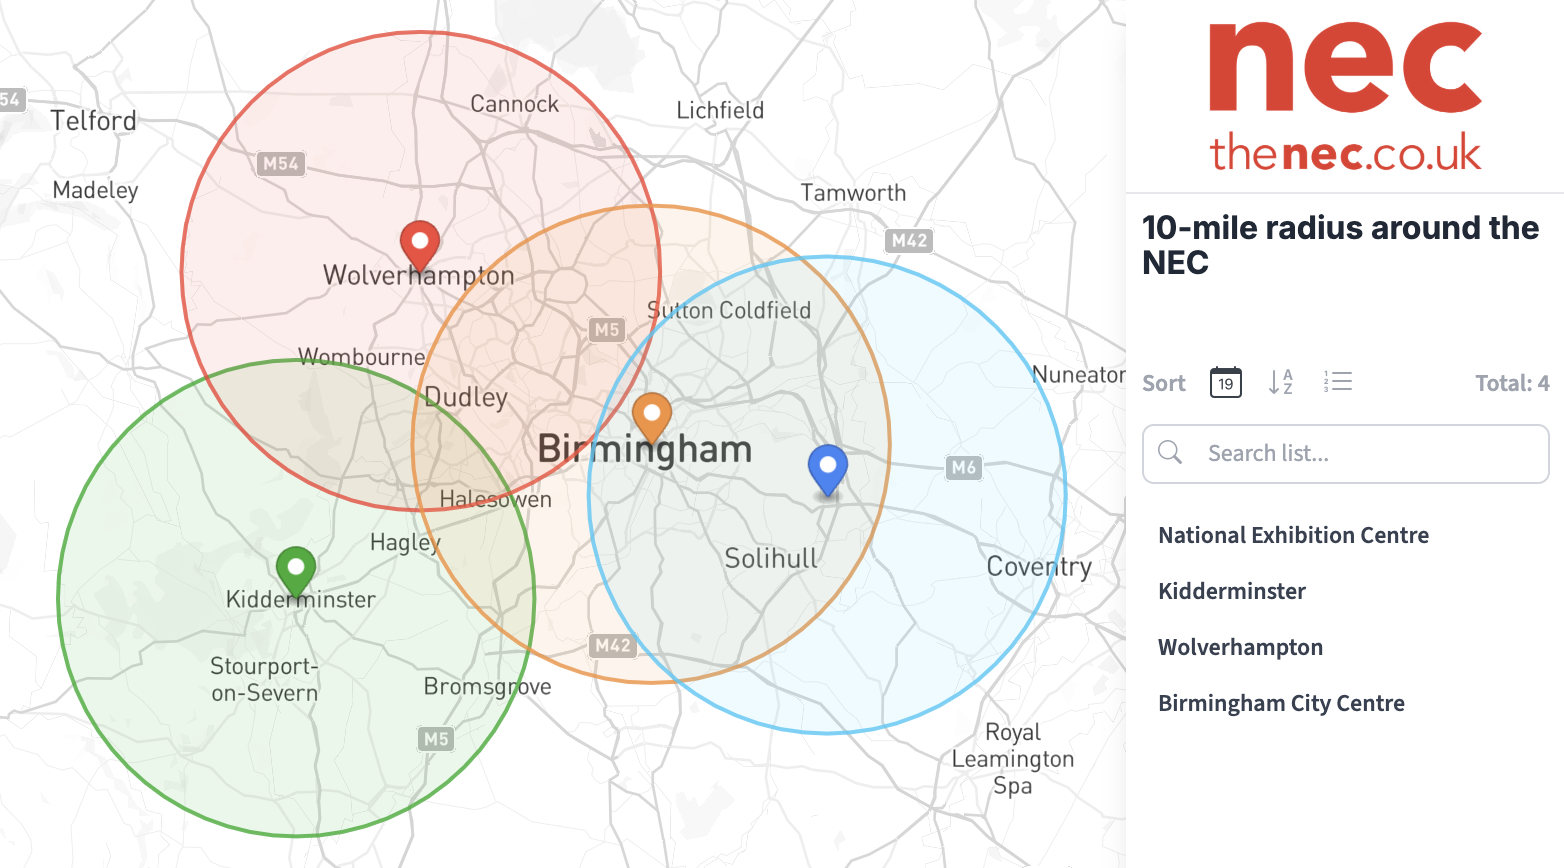
By default, if you set a radius or draw a polygon area anywhere over the UK or Republic of Ireland, our system will make a dynamic calculation of population (plus households for mainland Britain). The figures will show up by default in the popup when you move your cursor over the radius or polygon area – in both the Edit and Live Views.
Uncheck the box here if you don’t want this feature.
Some clients (such as marketeers) like to see the population and household figures themselves but do not necessarily want other parties to see the figures in the Live View. In which case we recommend duplicating the map, and keeping one version with the population and household figures, and turning them off on the other version that is for third parties or public viewing.
Add your company logo
You have the option to add your company logo at the top of the sidebar, which will show up in the Edit and Live Views. Click the Upload Logo button, or, if you have uploaded your logo previously, the Select from Library button. Save, and your logo will load in place at the top of the sidebar.
Info Panel
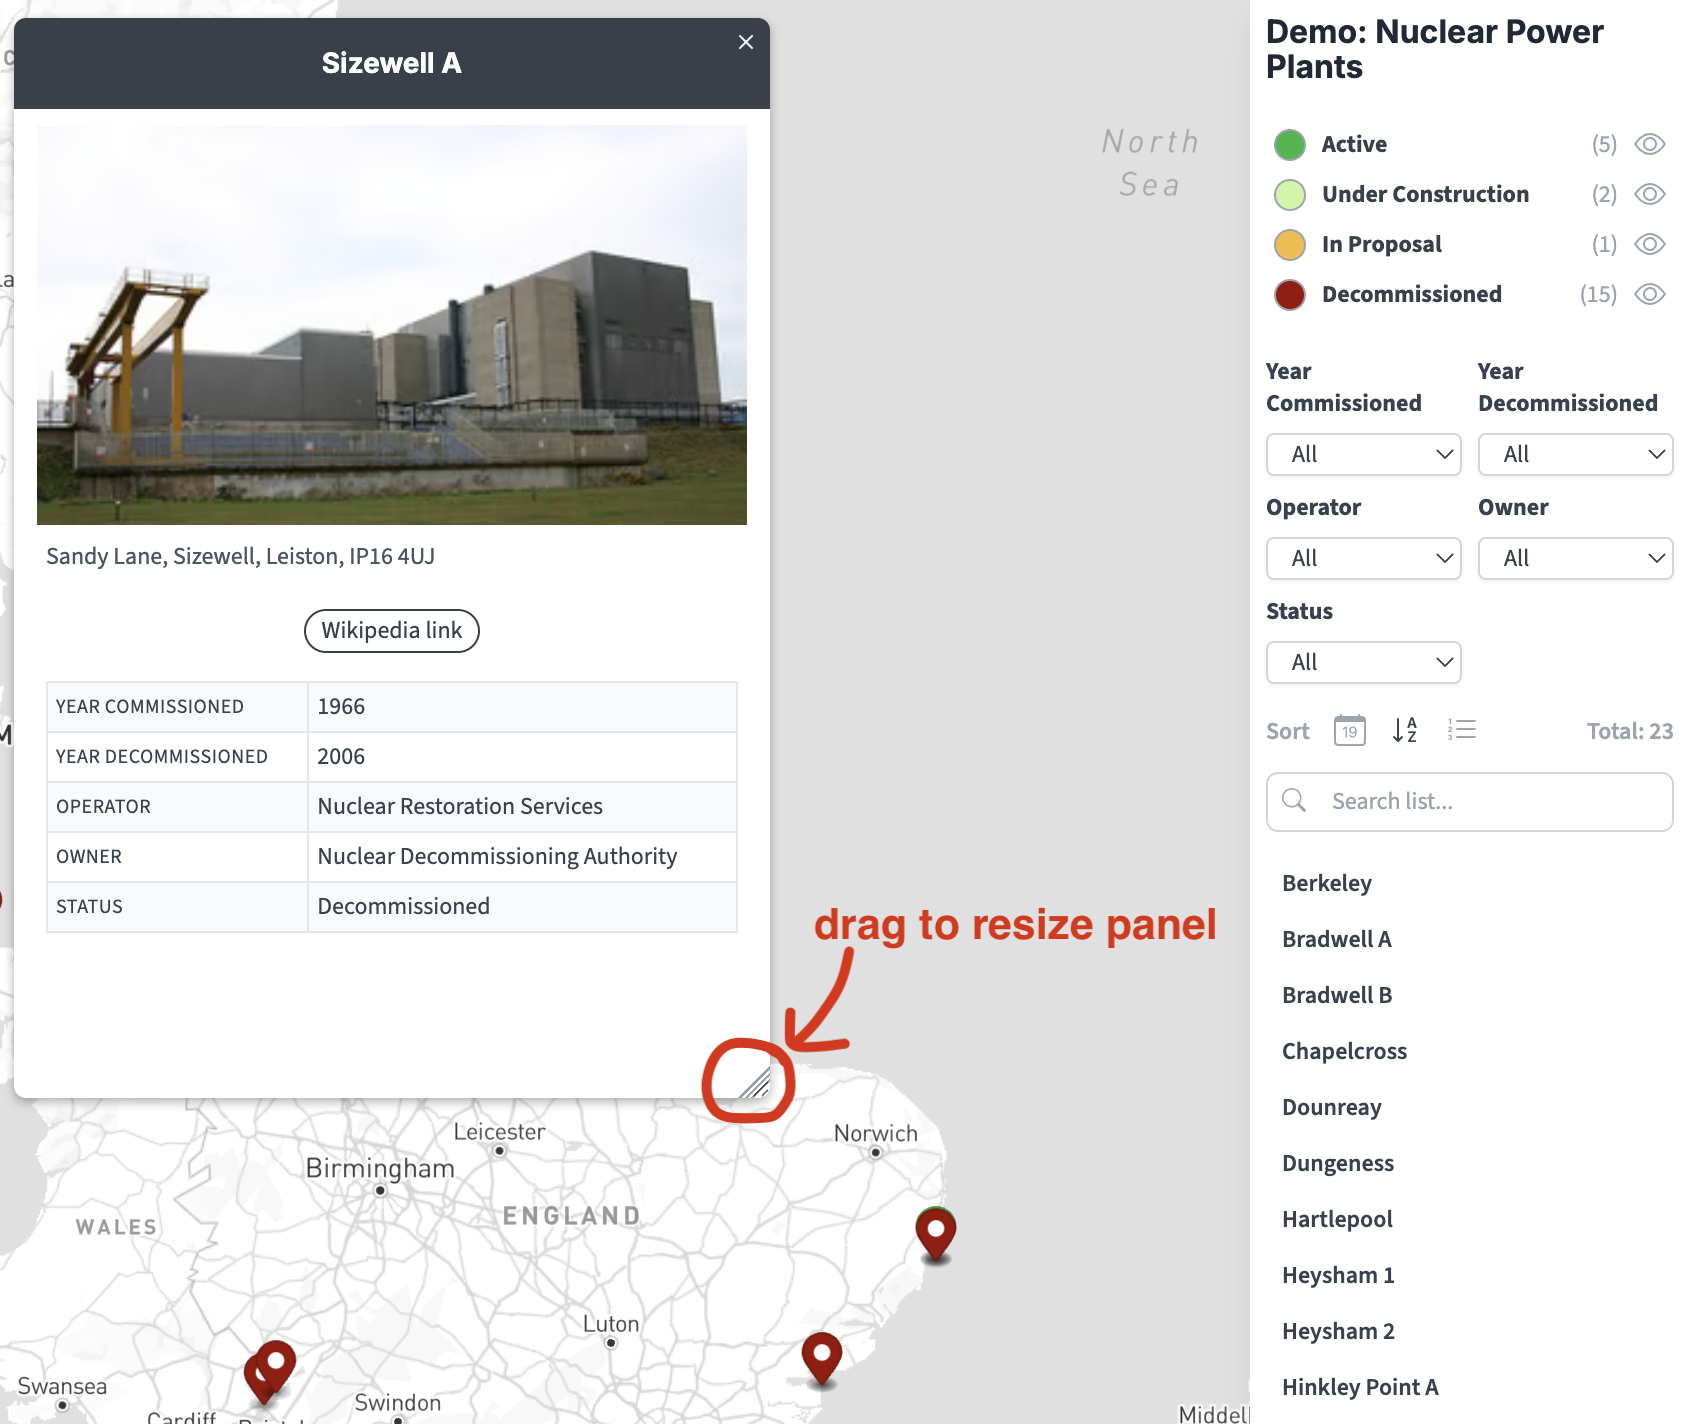
If you are putting a large amount of content into your popups, especially if adding images and categories, you might prefer the info panel option, which feeds the data to a panel on the left rather than centred over the clicked location. The panel size can be dragged from its lower right corner.
Opening map position
By default, the map will open over the UK and Ireland, then load your locations, then smoothly reposition itself to fit the extent of your plotted locations. The default positioning will fit any size screen. However, you can override this behaviour by saving whatever your current map position is in the edit screen as your opening view, including the zoom level, centre, bearing and pitch.