
On this page:
Set colour key filters
Set text category filters
Set auto-colouring by category
Colour keys and filters demo – click the colour key eye icons to toggle on and off, and see how the dropdown filters interact with both the map markers and listings
Set colour key filters
You will likely already noticed that you can set colours individually whilst plotting, and that little colour swatches show your recently used colours. You can turn marker colours into key filters, and vice versa. You can also set filters and auto-colouring when importing a spreadsheet.
Click Filters on the top bar to open a Filters panel.
If you haven’t started plotting any markers yet, you will have this in the panel:
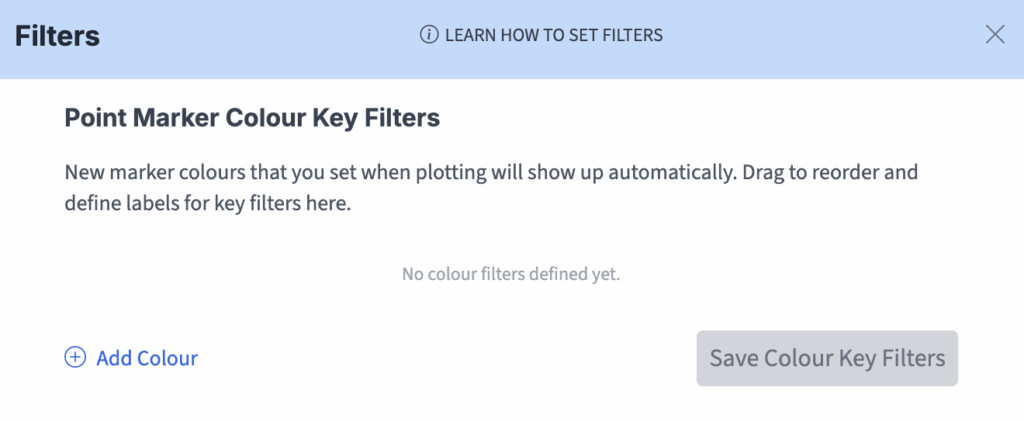
If you have plotted at least one marker, the colours you have used will automatically show up in the panel, such as here:
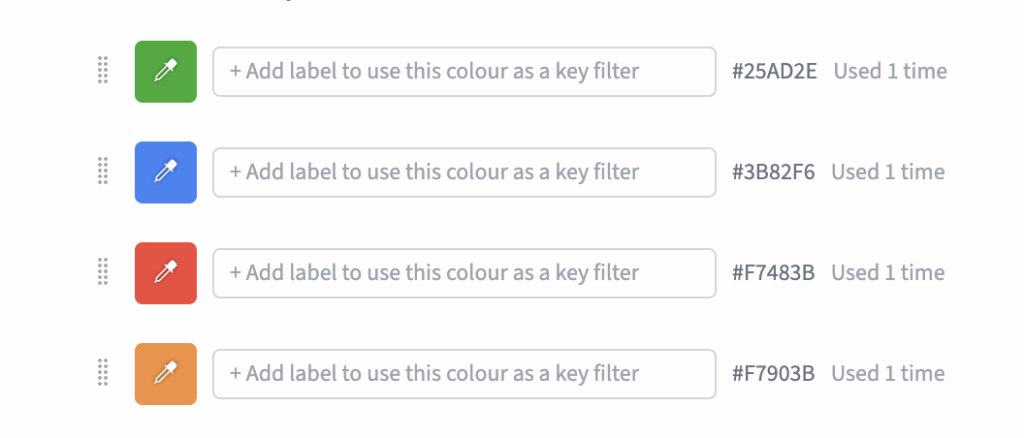
To set colour filters you simply add key labels for the colours. As an example, for our demo of Nuclear Power Plants, we set four colours with status labels – Active, Under Construction, In Proposal and Decommissioned.
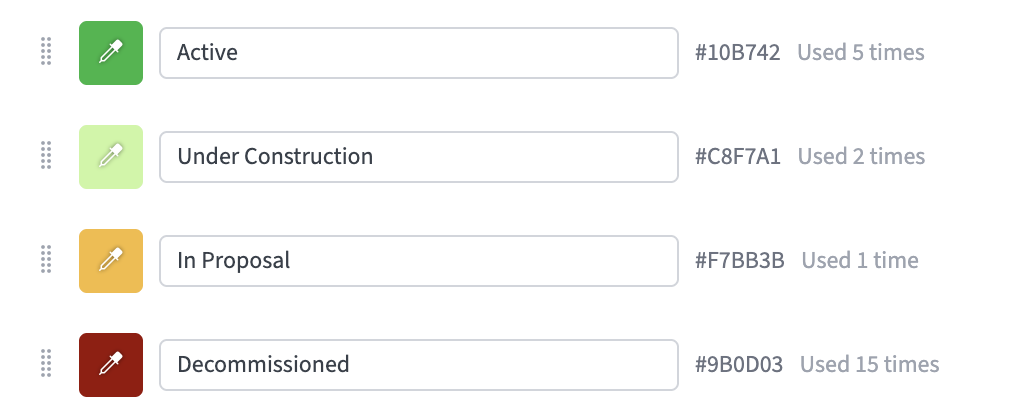
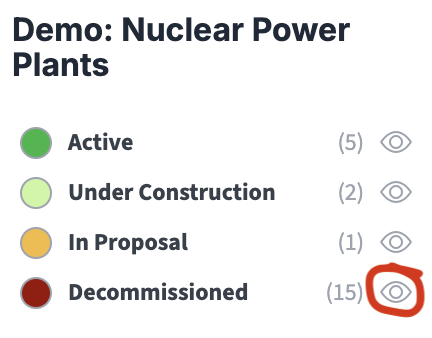
In the demo, see how the key colours are displayed top right. Try toggling the eye icons on and off to see how the map markers and listings in the sidebar toggle with the colour key filters. Also notice that in the Filters window there are drag icons for each filter so you can change the order in which they display in the key.
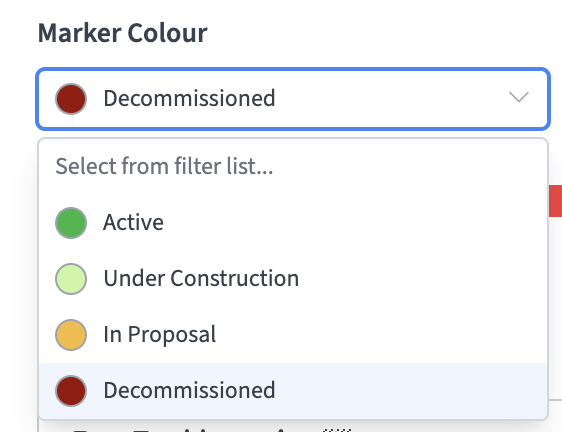
When plotting new locations, if you have set colour key filters they will show up in a select dropdown in the Add / Edit Location window under Marker Colour.
You can add new filters for markers at any time simply by going to the Filters window and setting new colours and labels. You can also change an existing filter colour by clicking on the eyedropper colour swatch in the Filters panel. For example, a change in colour shown below would automatically change the colour of all markers using the ‘Under Construction’ colour filter in the Nuclear Power Stations map.
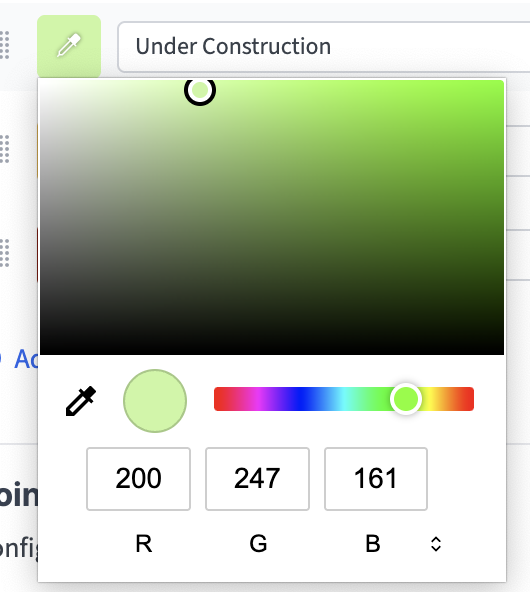
TOP TIP: You must set a label for a new colour in the Filters window in order for it to be shown in the key and to be usable as a filter.
Set text category filters
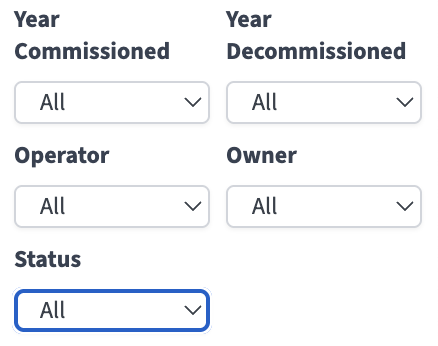
Also in the Filters window and demonstrated in the Nuclear Power Plants demo are Point Marker Text Category Filters. Experiment with these to see how they work as filters. Especially, note that they work together to quickly narrow down the selection. This is an important concept in filtering. Whereas the colour filters are additive (the more that are on, the more you see), these category dropdown filters are subtractive (the more you select, the fewer you see). For this reason, whilst you can have as many additive colour filters as you want, we only offer 5 fields for subtractive filters, and present them in a completely different way. Also note, in the Nuclear Power Plants demo, status (Active, Under Construction, In Proposal, Decommissioned) is shown with colour key filters AND the subtractive category dropdowns.
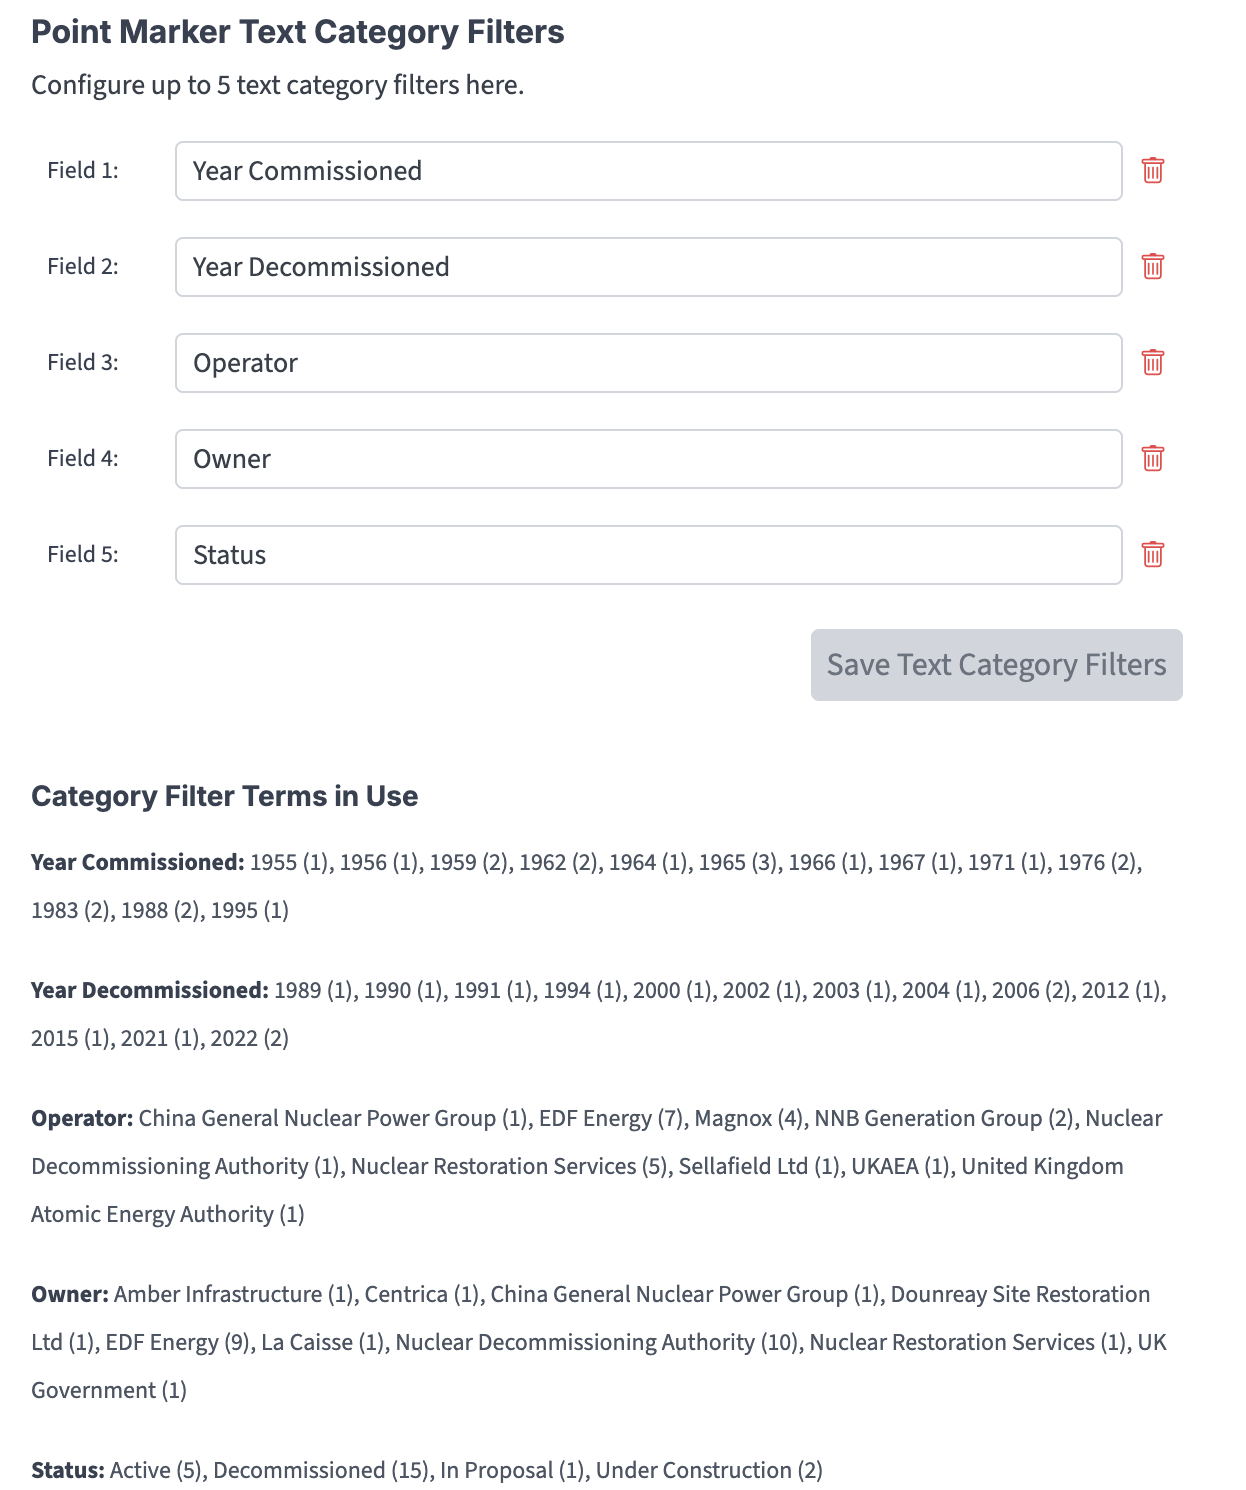
Once you have added one or more text category filters, they will show up at the bottom of the Add / Edit Location windows.
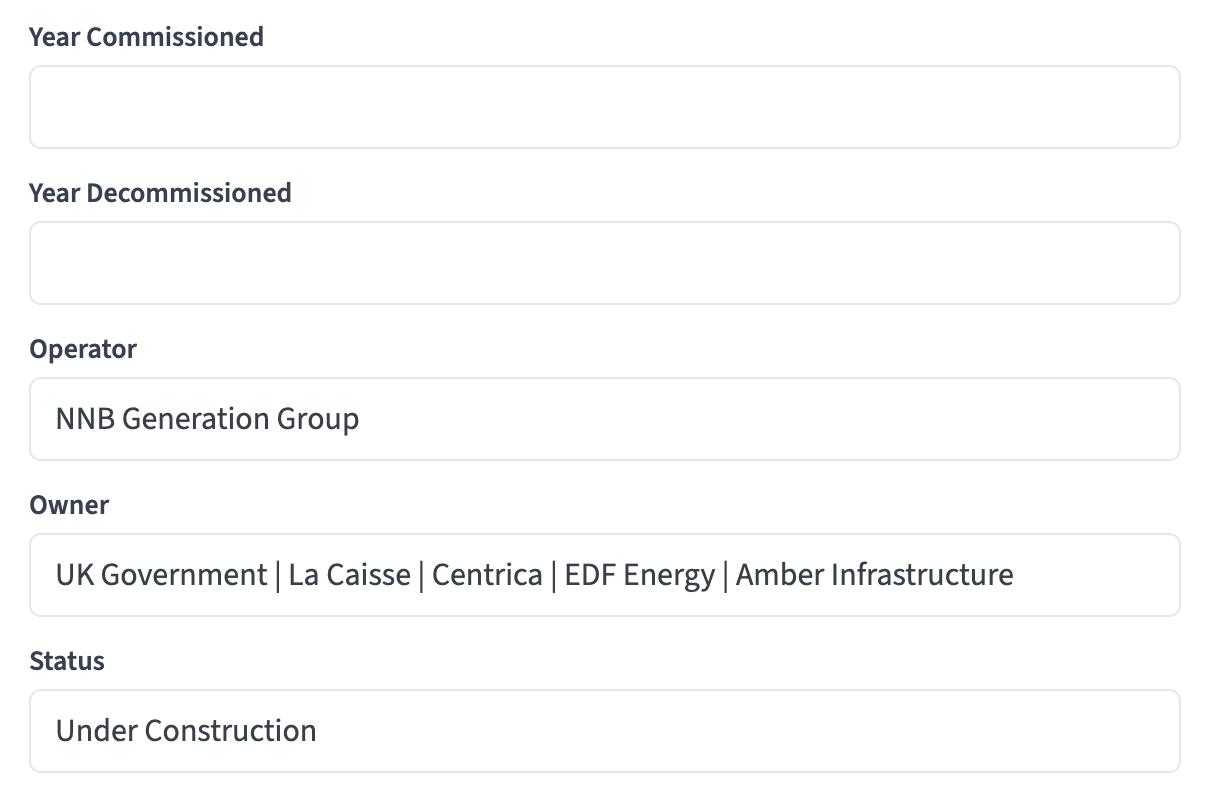
In the example above, notice that you can have multiple terms separated by pipes. Each term will be treated individually if you express them like this in the field:
Term 1 | Term 2 | Term 3 | Term 4
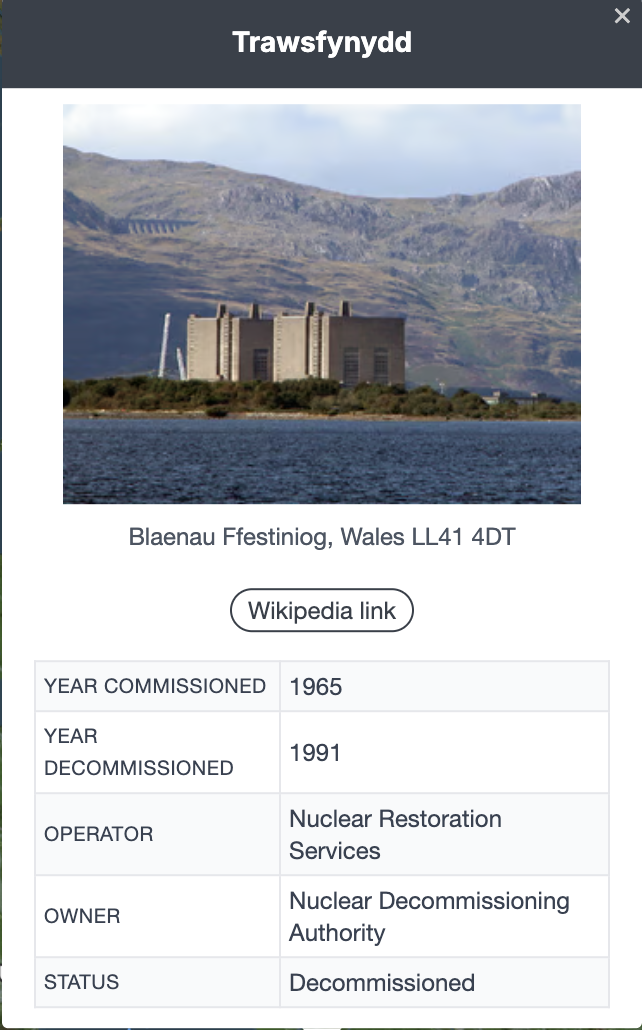
Also notice that the category terms show up automatically in a table in the location popups.
Set auto-colouring by category
If you’ve set any text category filters, or if you’ve imported multiple data columns from a spreadsheet, these will be made available for auto-colouring. The system will examine the current state of unique terms in your data and assign a separate colour for each one. The key with colours and labels will build automatically with each map load and edit.
You can change all colours that are assigned.
