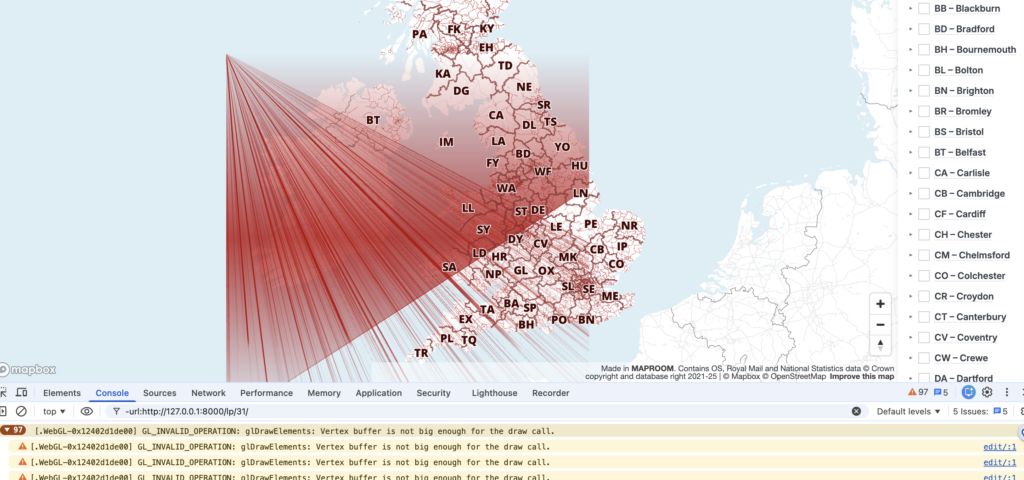
A month ago, the Maproom directors spotted that one of our demo maps was inexplicably showing hundreds of rays emanating from a point in the Atlantic Ocean off the northwest coast of Ireland.
We found odd bugs on several other maps – maps that had worked perfectly for years in all major browsers were displaying peculiar artefacts at different zoom levels. The artefacts were observed only in Chrome, not Safari, Edge or Firefox.
The Chrome browser console was logging the error: “GL_INVALID_OPERATION: glDrawElements: Vertex buffer is not big enough for the draw call.” This was not an issue we had encountered before.
The first instinct of most developers is to assume that we had broken something ourselves. However, after checking recent deployments, testing different datasets, reviewing JavaScript changes and trying to reproduce the issue across multiple environments, nothing pointed to a fault in our Dynamic Mapping Suite. We could see the artefacts occurring in the Mapbox bases too, but it wasn’t Mapbox at fault either. The culprit for the messed-up maps was much further down the stack: to be precise, the most recent update of Chrome: version 148.0.7778.168 and its handling of Apple’s Metal API for ANGLE.
In simpler words, Chrome’s update in early May messed up the way in which an Apple Mac reads and renders complex web graphics!
Not just our maps
The problem wasn’t limited to Maproom.
Developers across the geospatial sector reported similar issues on Apple Macs, especially Macs running Intel chips. Esri, for example, documented a Chromium defect that caused rendering failures and WebGL errors in applications built with the ArcGIS Maps SDK, affecting map display and performance.
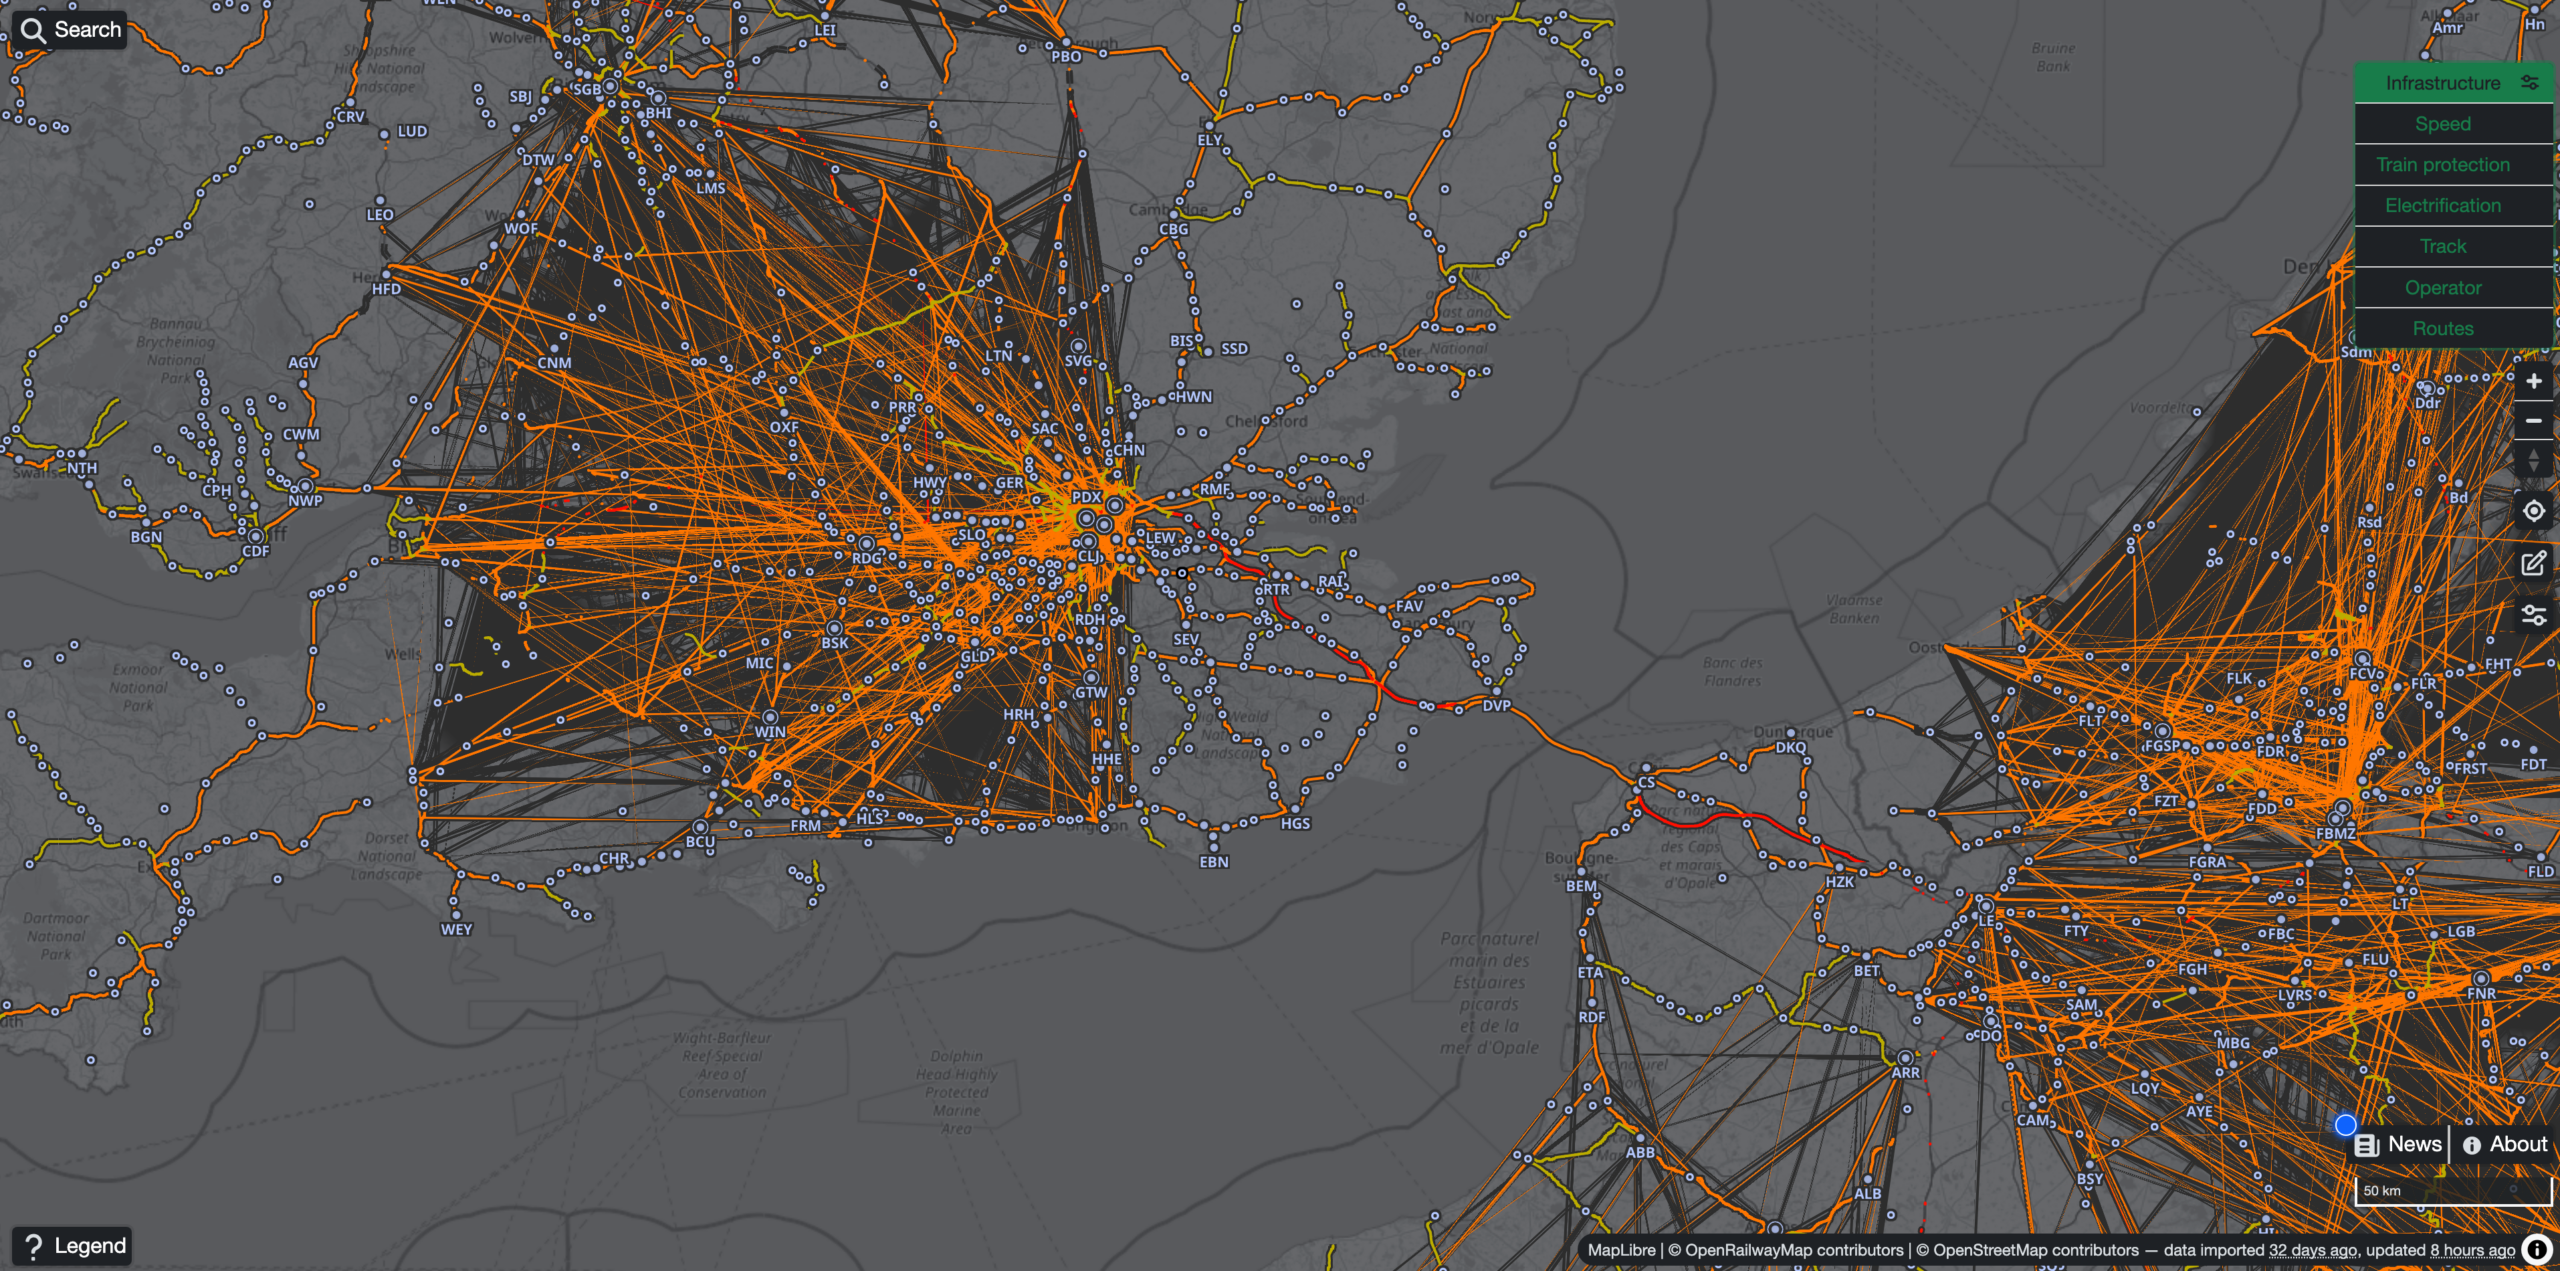
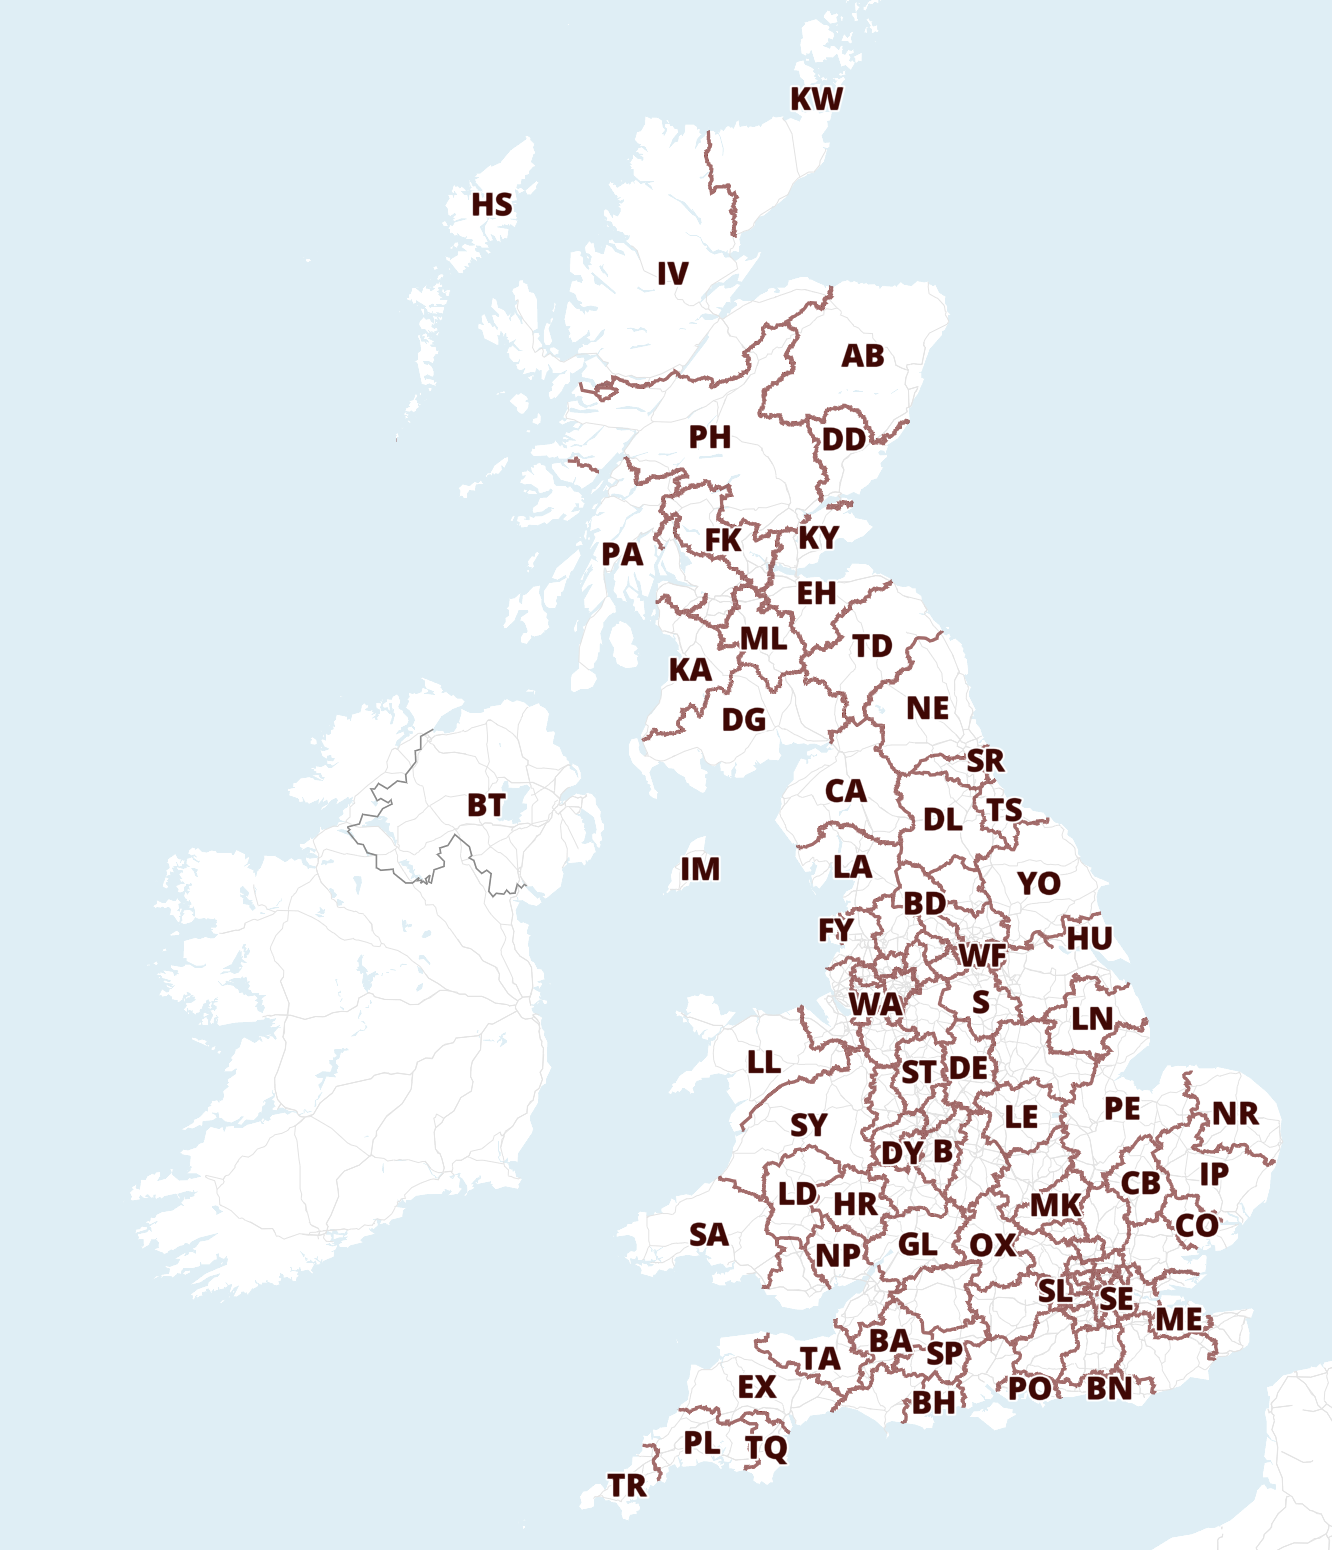
We spotted a bewildering range of major rendering problems on everything from UK government boundary maps to interactive train routes and multi-layered history maps made by other geospatial cartographers. Even some interactive maps built on Google’s own Google Maps were broken on Apple Macs by Google’s Chrome update.
Mapping applications push browser rendering systems far harder than typical websites, thus advanced interactive maps were the first casualties of Chrome’s bug in May 2026.
The complex technical issue including our own report is logged by Google’s Chromium team here: https://issues.chromium.org/issues/513487198.
The good news
Google’s Chromium team investigated the issue on the day that we and other GIS developers reported it and admitted culpability with a solution promised to be in the offing.
Whilst waiting for several weeks for the solution to be applied, we found a temporary workaround during the period of disruption, which was to reduce the number of map layers from loading at low zoom levels. This was not a perfect fix, as there were still faint, almost ghostly line artefacts showing, but the sheer visual disruption was minimised.
We are relieved to report that he bug has now been fixed by the Chrome developers wtih Chrome version 149 released in the first week of June 2026.
For anyone who experienced broken Maproom maps on their Mac computers during the affected period (about a month), we hope this did not disrupt your workflow too much, or put you off interactive mapping.
If you are still experiencing peculiar interactive map rendering using Chrome on an Apple Mac, the solution is to update to Chrome’s latest version.