Maproom’s superb interactive UK Parliamentary Constituencies map shows all 650 Parliamentary seats and helps users find constituencies and MPs with electorate info. Zoom deep, tap on areas of the map and use search to fly round the country. This political map is a great demonstration of how we can build a dynamic interactive online map fed from a spreadsheet.
How the interactive map is constructed with polygons and data from a spreadsheet
1 – Online map base
There are a number of online map services which can be manipulated by developers. The best known is Google Maps, but our current favourite is Mapbox, which allows complex styling of OpenStreetMap (OSM) data and has a range of useful functions in its javascript API. It is at the cutting edge of geocoding development, in our view.
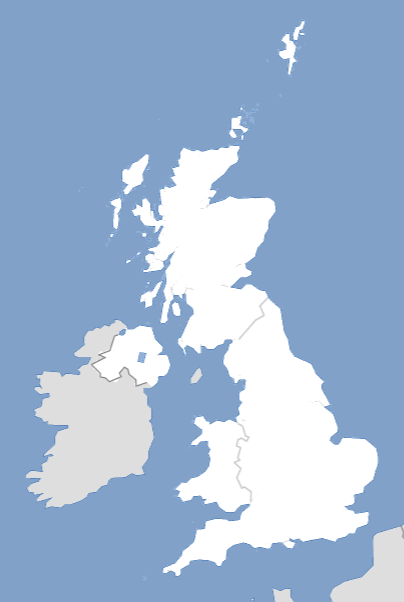
For the UK Constituencies Map we have started by styling a Mapbox base quite simply with white landmass and a fairly strong blue-grey for the sea. The coloured constituencies are going to be overlaying the land in a later step, so having a white landmass backdrop is essential for opacity effects, whilst the blue-grey sea needs to provide enough distinction from the semi-transparent constituencies to define them without overpowering their colours.
When the user zooms in deep to the map, the road network will show up on the Mapbox base. This is one of the great features of Maproom’s constituencies map – you can zoom in and out to see great detail of constituency boundaries as well as the overview of the entire UK all in one map.
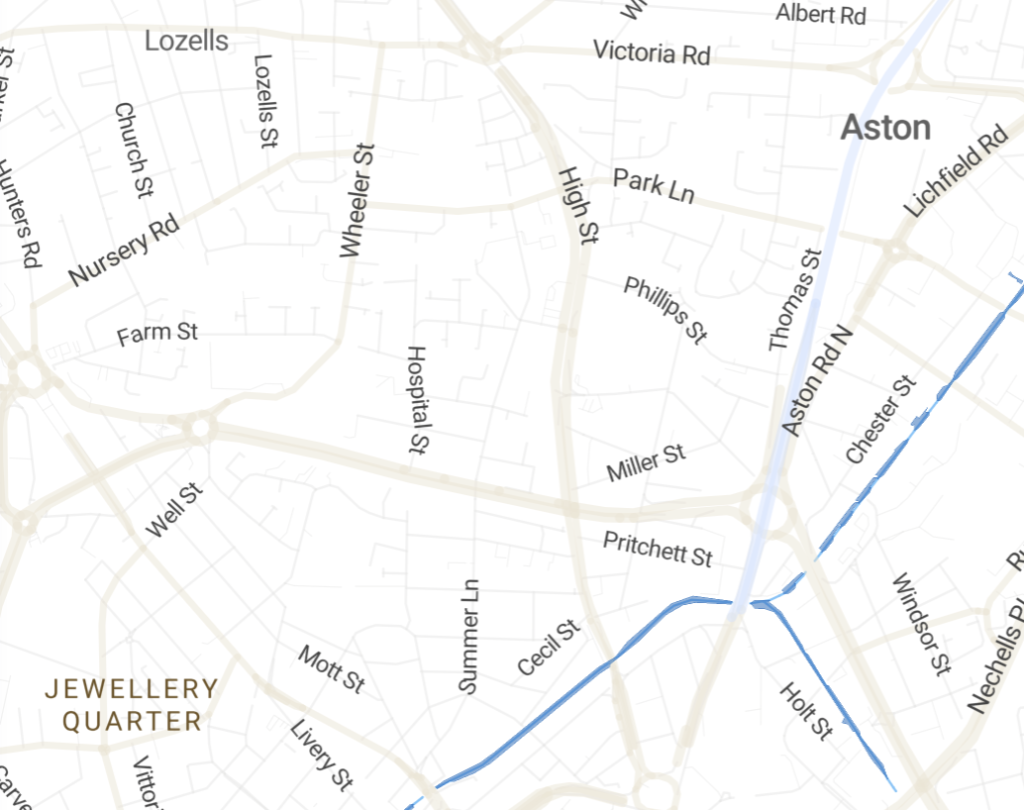
Static screenshots of the map base in Mapbox showing the whole UK and a zoomed in portion of the road network around Birmingham
2 – GIS data manipulated to create a layer of interlocking polygons for the parliamentary constituencies
Geographical Information Systems (GIS) are all about the handling of coordinates and projection systems in formats such as shapefiles, geojson, geoTiffs and many others. GIS files contain raw data – code, not imagery. However, they can be processed with specialist GIS software and turned into a map image.
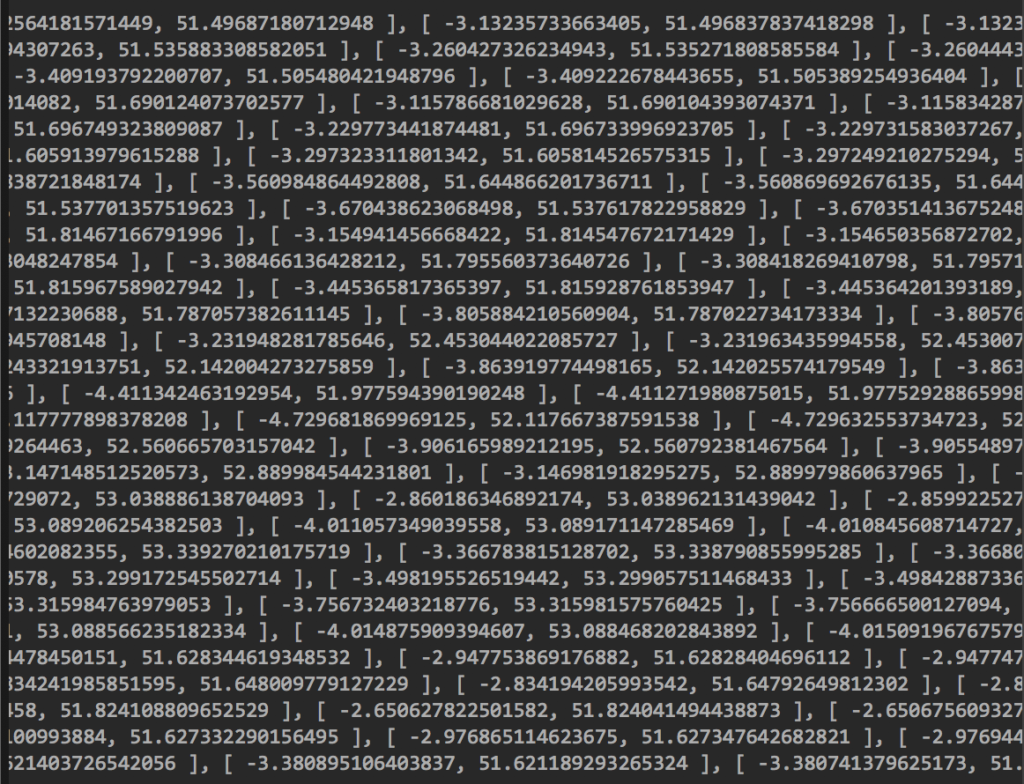
The UK’s 650 parliamentary constituencies are composed of interlocking polygons. Maps with interlocking polygons are some of the hardest to create because they need perfectly matching boundaries, and many map polygon datasets are extremely expensive because they are so time-consuming to produce and maintain. Fortunately for the sake of our demo, the government provides GIS data for parliamentary constituencies free of charge from the Office for National Statistics.
For the Constituencies map, using a mixture of Avenza MaPublisher and QGIS software, we cleaned up the government’s dataset and produced centroid point data for labelling the constituencies. The centroid point data was uploaded separately and loaded directly to the Election map base.
The polygons data was exported in geojson format then converted into a Mapbox-specific compressed format called mbtiles using a line-command tool called Tippecanoe available from Github. We then uploaded the mbtiles file to Mapbox as a dataset layer with polygons for the parliamentary constituencies.
This manipulation and separation of GIS data makes it possible to make the map itself interactive with hover and click effects.

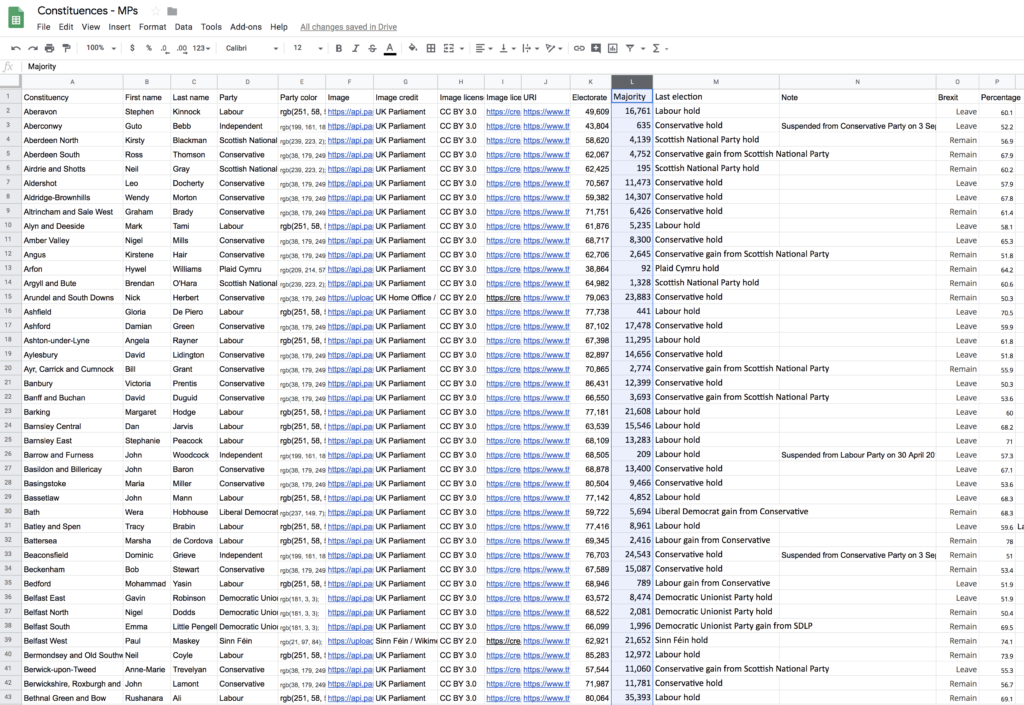
3 – An easy-to-edit Google spreadsheet to control the popup box information, the colours and the auto-count of seats per party
The spreadsheet element is the main reason for this demo. The online map may be highly complex, but we want non-technical editors to be able to update it easily simply by editing a spreadsheet. The spreadsheet contains all the popup box information, and it also controls the colours on the map and even the automatic count of seats per party.
With a Google spreadsheet changes save themselves instantly, and the map automatically updates itself within seconds – no need to keep uploading files. This feature really comes into its own when you have a rapidly changing situation, such as when results flood in on election night!
4 – HTML with javascript, geojson and the Mapbox API to bring it all together
All web designers and developers are familiar with HTML and javascript, but not many use geojson or mapping APIs. Maproom’s system pulls in geojson output from the spreadsheet and compares it with the polygons data layer in Mapbox before overlaying the semi-opaque coloured constituencies on top of the map base, together with the popup-info boxes.
The final result is a highly detailed map containing literally millions of pieces of data in a compact space, which loads quickly, is interactive on multiple levels, is sharp at every zoom level and is incredibly easy and quick to update.
We hope you enjoy using Maproom’s UK Parliamentary Constituencies map.