
Bespoke map created for Life Ledger, an innovative death notification service. Two separate lists, branding colours, specially created icons, and a tailored image upload area for multiple company logos. The map is embedded on the client’s website.
New census mapping
The Office for National Statistics has started to release data from the Census 2021. Below are some interactive England and Wales population maps that users can freely use on their own websites. Or commission us to create maps like these using other census data or marrying up census figures with your own data.
Hover or tap different parts of the maps for data interaction
Population change between 2011 and 2021, local authorities in England and Wales
Age structure of the population, 2021, local authorities in England and Wales
Population density, 2021 and changes since 2011, local authorities in England and Wales
Changes in the number of households between 2011 and 2021, local authorities in England and Wales
Our 3d map of British and Irish mountains is an immersive demo of new techniques with advanced satellite imagery and filters
Mapbox – our favourite dynamic mapping base system – released a new system based on Maxar satellite imagery last year, whereby geospatial developers such as us can tap into elevation and projection for satellite views layered with our own points, lines and polygons. We have experimented with the new 3d system in conjunction with our own techniques developed for listing and filtering, and come up with a rather sublime demo using data from The Database of British and Irish Hills.
Open full-size dynamic mountains map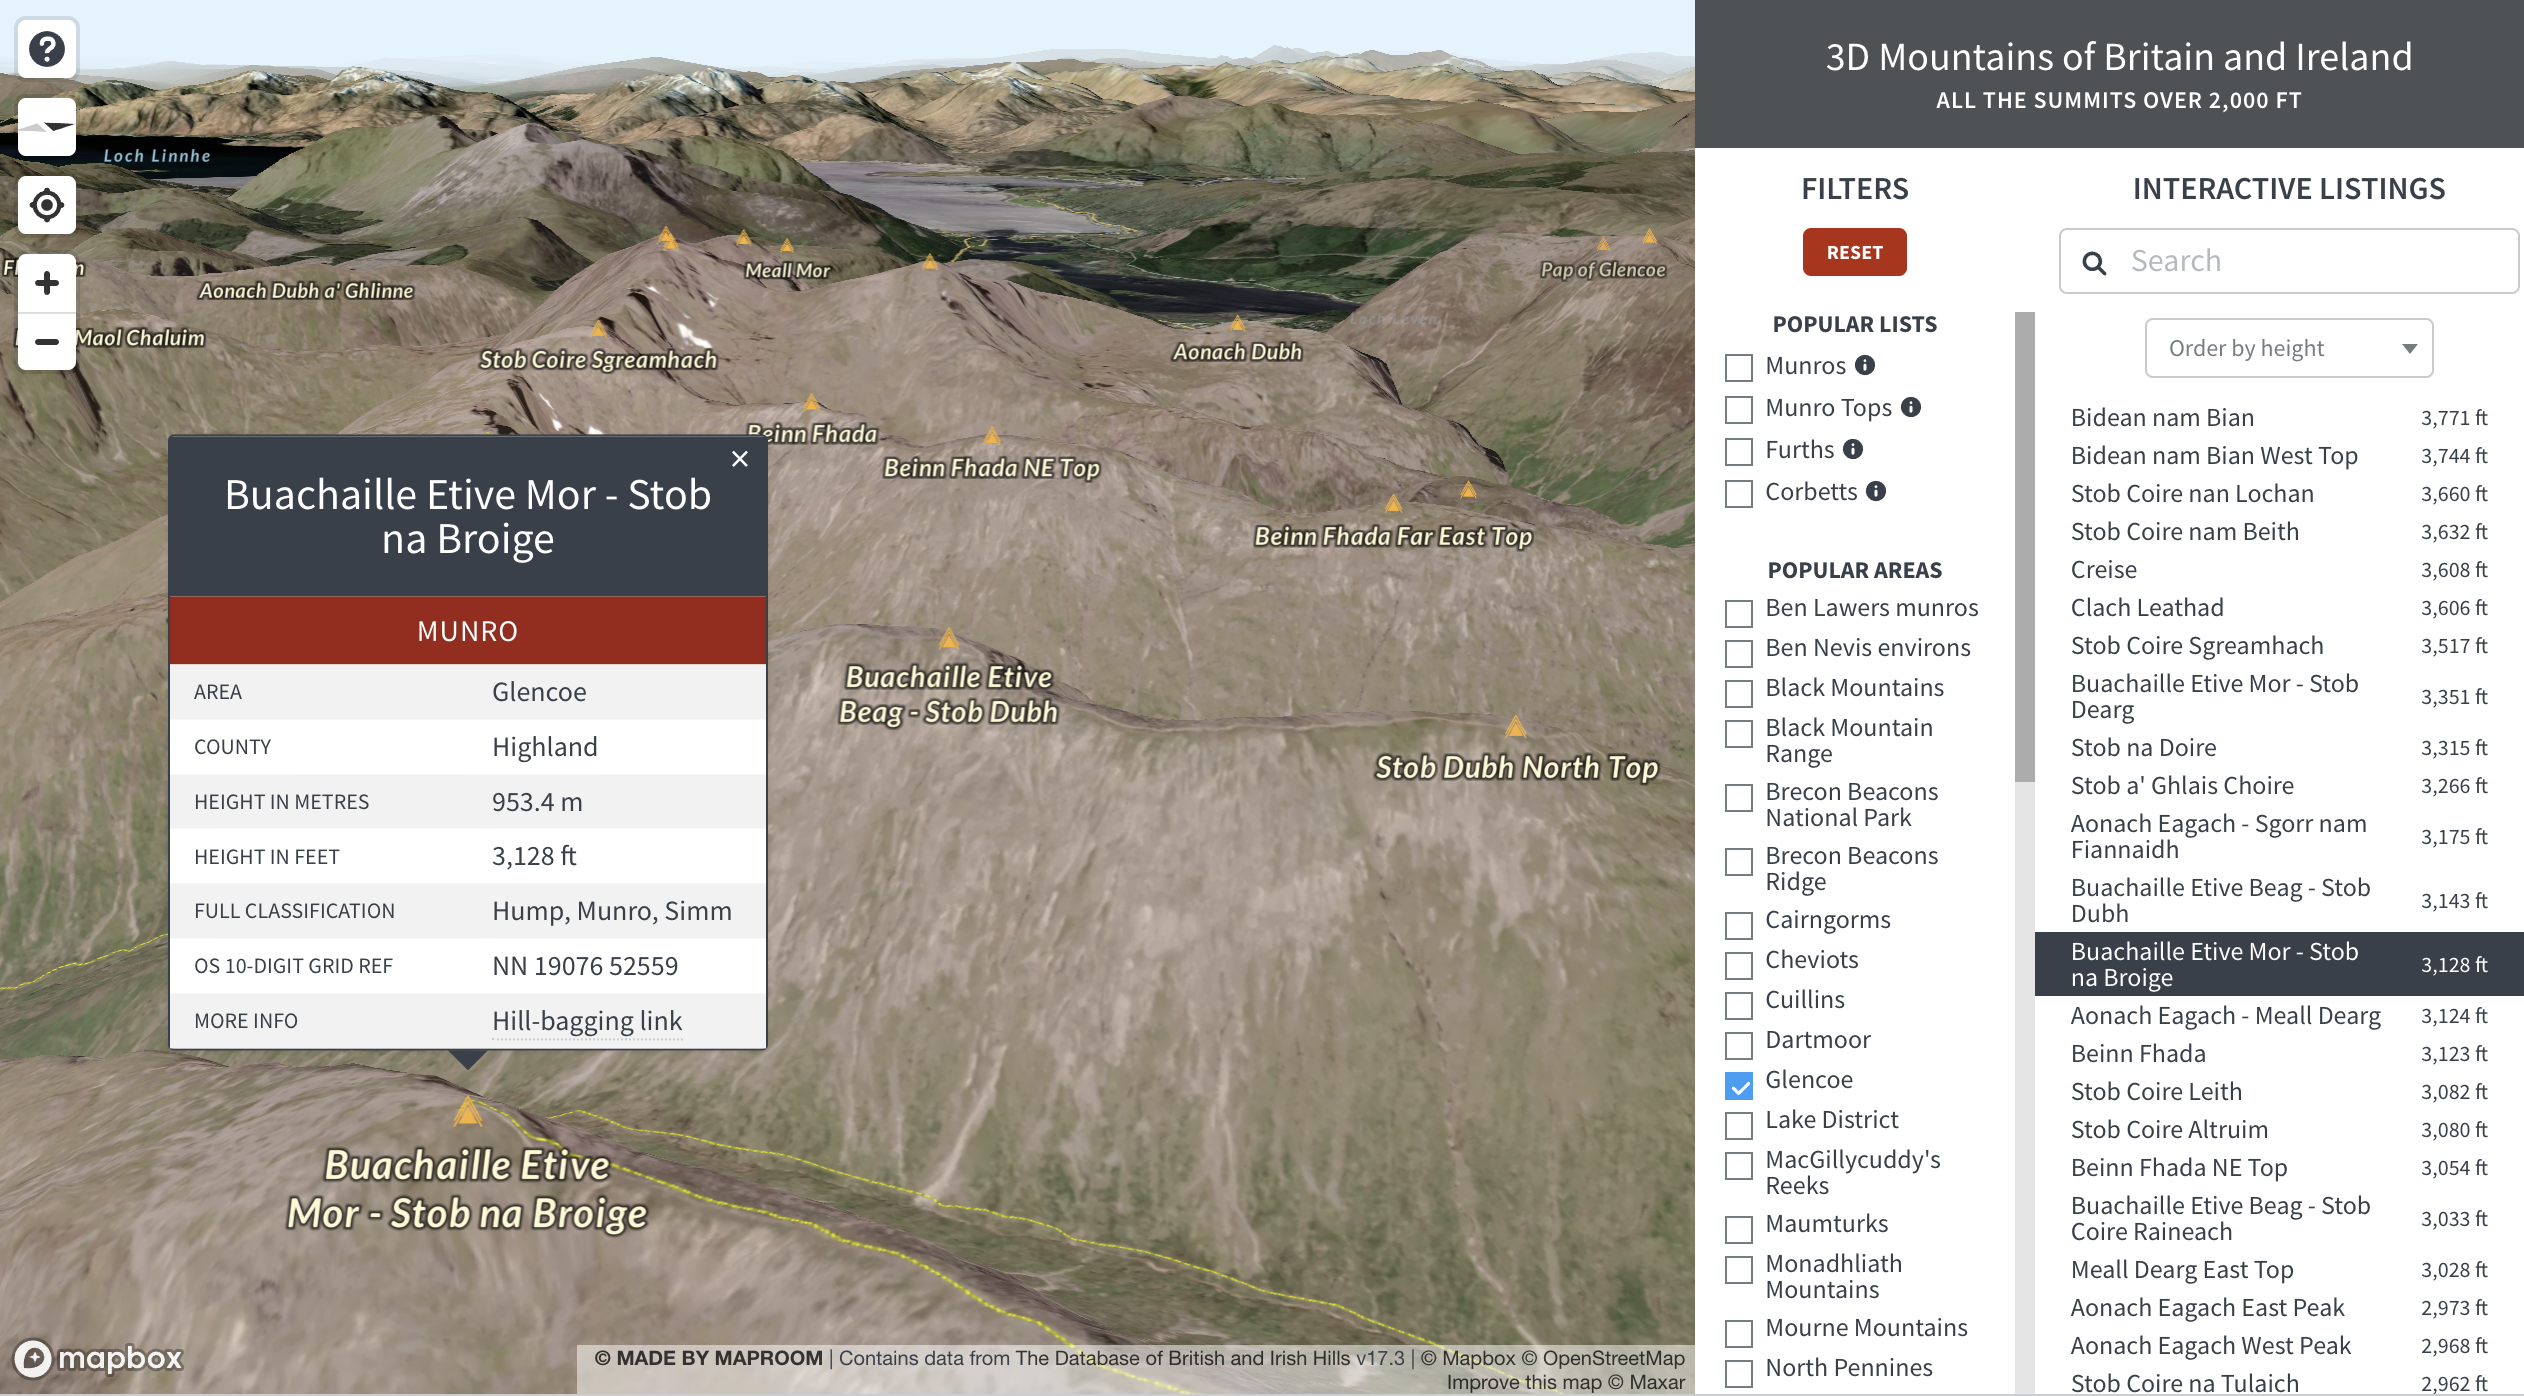
Learn more about how we feed data to dynamic maps like this on the 3d mountains exploration demo page.
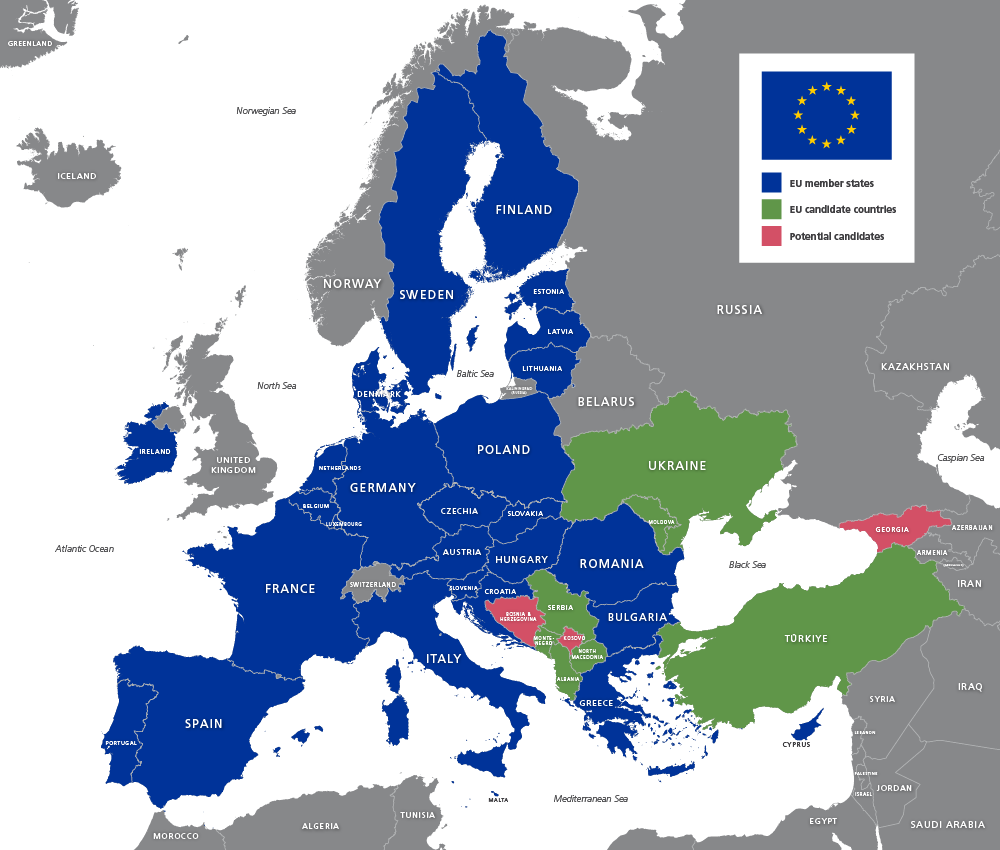
Europe and world maps updated for geopolitical events in 2022
The United Nations have accepted Turkey’s official name spelling change to Türkiye with immediate effect, and Ukraine and Moldova have been accepted as EU candidate countries. Therefore we have updated our full set of Europe, EU and world maps to reflect these developments.
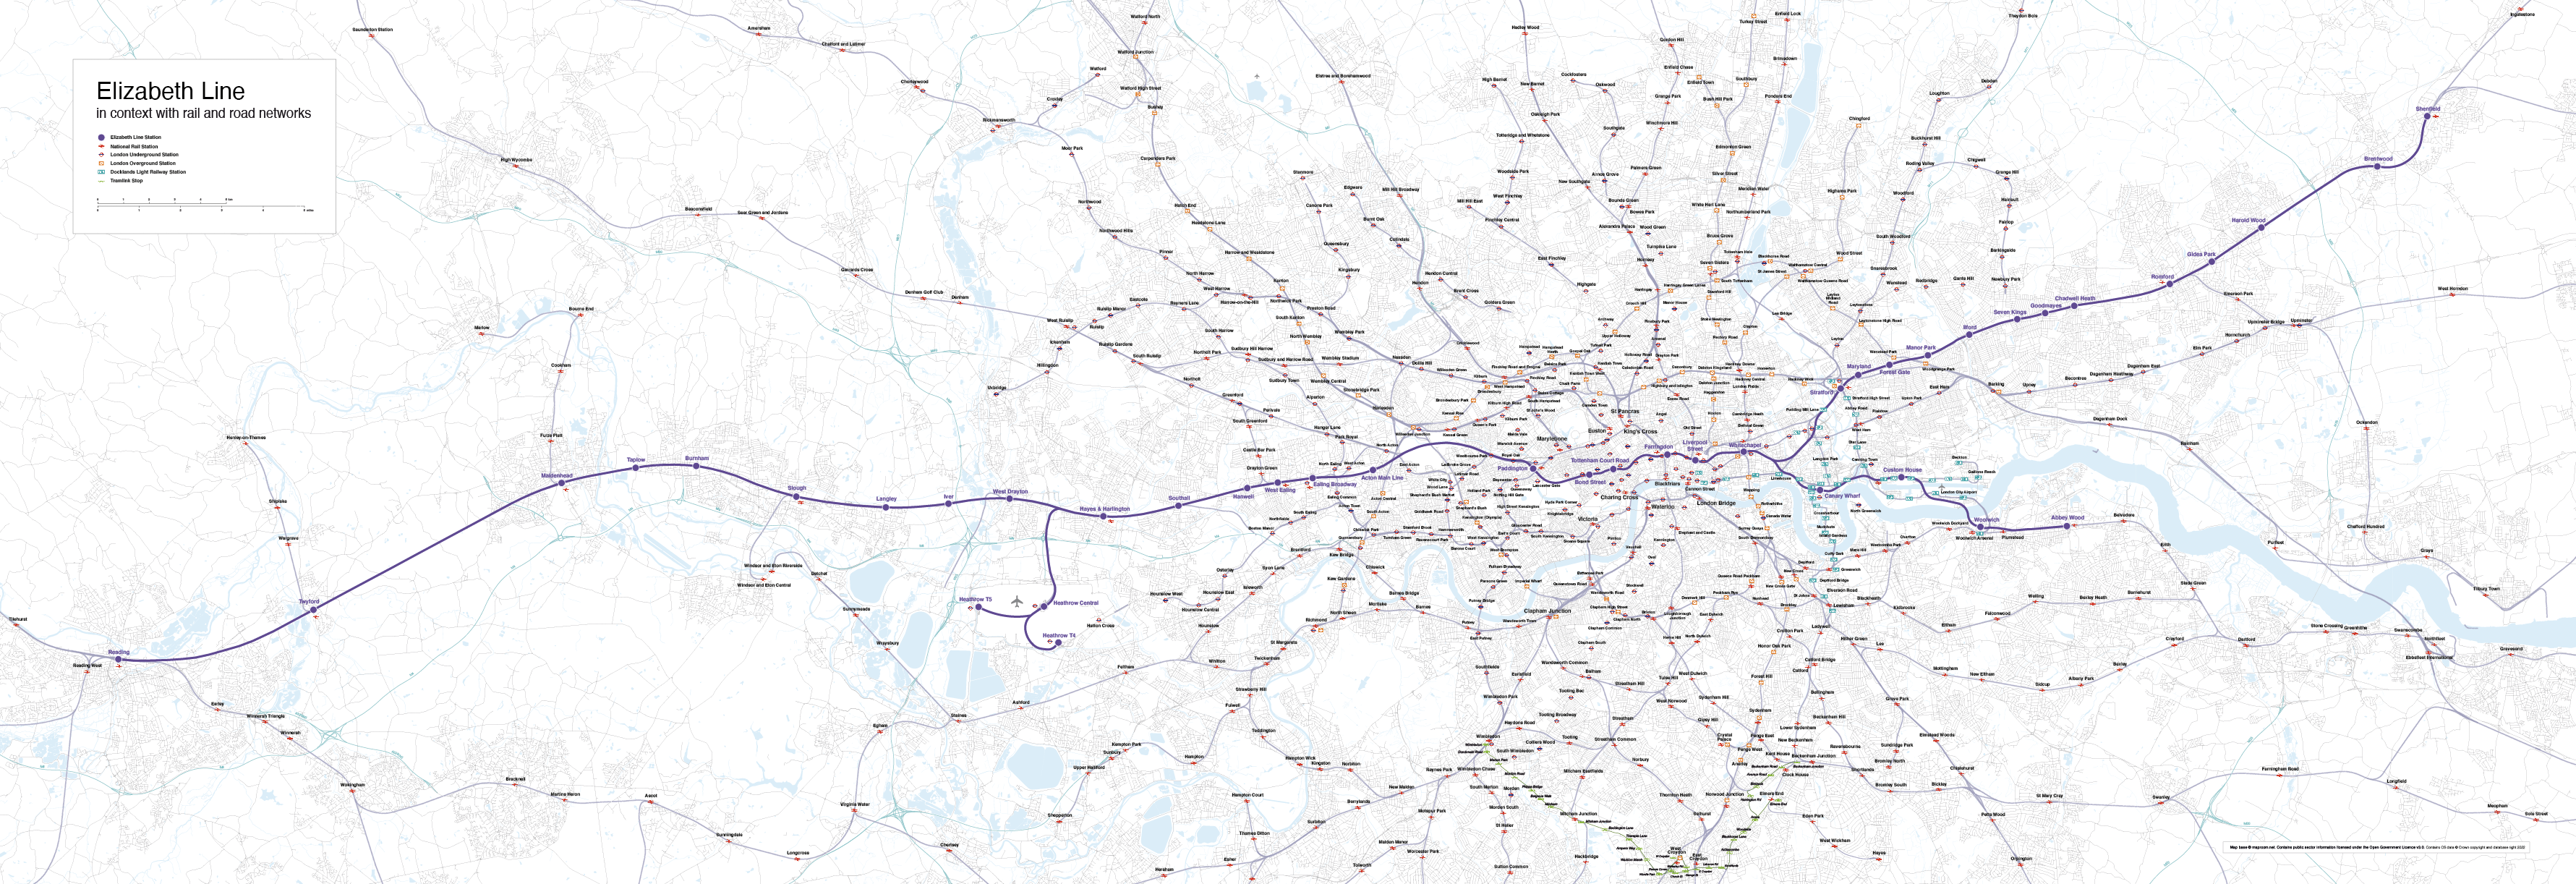
Mapping the Elizabeth Line
We were surprised to be contacted by quite a few people requesting a map showing the Elizabeth Line in geographical context. Like all of the UK’s official free rail maps, Transport for London’s map of the Elizabeth Line, available here, is meant for schematic visual clarity in route planning. It doesn’t attempt to show distances or other geospatial relationship. However, for town planners, property developers, marketeers and numerous other businesspeople and public sector organisations, it is useful to see the fuller picture of the Elizabeth Line. We have made the map for such people, and we have made it editable (ideally with Adobe Illustrator) and royalty free to use.
Purchase the new map on this product page: Elizabeth Line map with rail and road networks.
Mapbox and Google Maps fees for high web traffic
At Maproom we build most of our interactive web maps on a Mapbox base. We also sometimes use Google Maps as a base. Both systems have their merits and weaknesses; both charge fees for high usage; and both are in a constant state of development and competition with each other and the smaller players on the dynamic mapping scene. Here’s a current comparison of Mapbox and Google Maps.
| System | Pros | Cons |
|---|---|---|
| Mapbox – used to power reference maps in our Dynamic Mapping Suite | Far more customisable than Google Maps Cheaper than Google Maps for high traffic Various ways to handle large data feeds | No Streetview Mediocre search Not the highest resolution for satellite maps |
| Google Maps – used by us for some bespoke dynamic maps requiring Streetview or the highest resolution satellite imagery of London | Streetview and the best search of all mapping systems | Completely unable to handle advance styling or large data feeds |
Usage
All web maps built with Mapbox and Google Maps are metered for usage. Usage means the number of times per month that a Google Map or Mapbox map is loaded. If, say, your website has a page with a Google Map embedded on it, the number of hits that page gets each month will count as the load.
Free tiers
Currently at the time of writing, the free threshold traffic for Google Maps is up to 28,500 loads per month, and for Mapbox it is up to 50,000 loads per month.
The majority of websites fall well below these thresholds and thus have free usage of the Google Maps and Mapbox bases upon which Maproom builds dynamic maps.
However, organisations with busy websites need to know about possible charges!
High traffic charges
(As at June 2022)
| System | Costs per 1,000 Monthly Map Loads |
|---|---|
| Mapbox | FREE up to 50,000 monthly map loads and 100,000 monthly search terms $5 per 1,000 from 50,001 – 100,000 loads $4 per 1,000 from 100,001 – 200,000 loads $3 per 1,000 from 200,001 – 1,000,000 loads negotiable from 1,000,000+ loads More details at Mapbox pricing |
| Google Maps | FREE up to 28,500 monthly map loads $7 per 1,000 above 28,500 map loads $14 per 1,000 for Street View $5 per 1,000 search terms More details at Google Maps pricing |