A powerful yet easy to use system of connecting spreadsheets to colour and label polygon maps is now available in our Dynamic Mapping Suite, and it costs only a very modest £35 to use.
Currently available for dynamically colouring and captioning from spreadsheet:
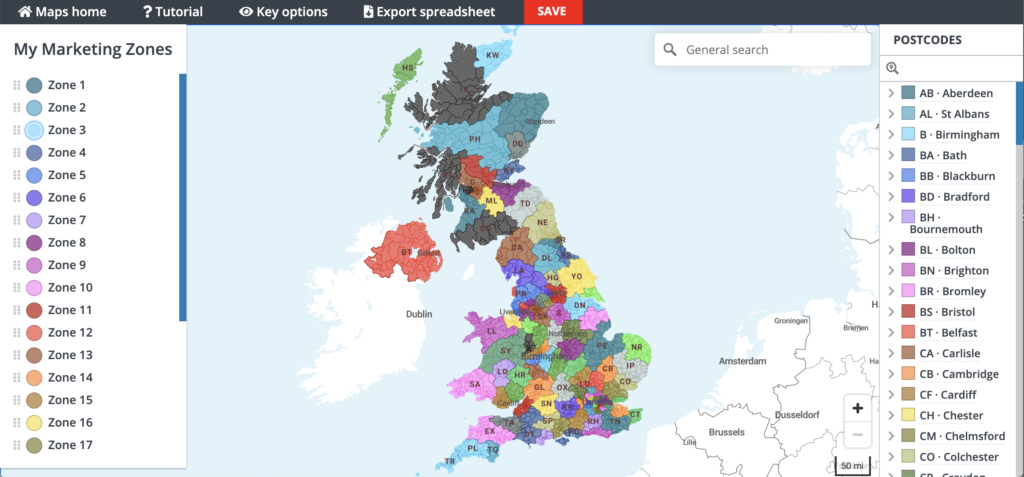
- Postcode Districts
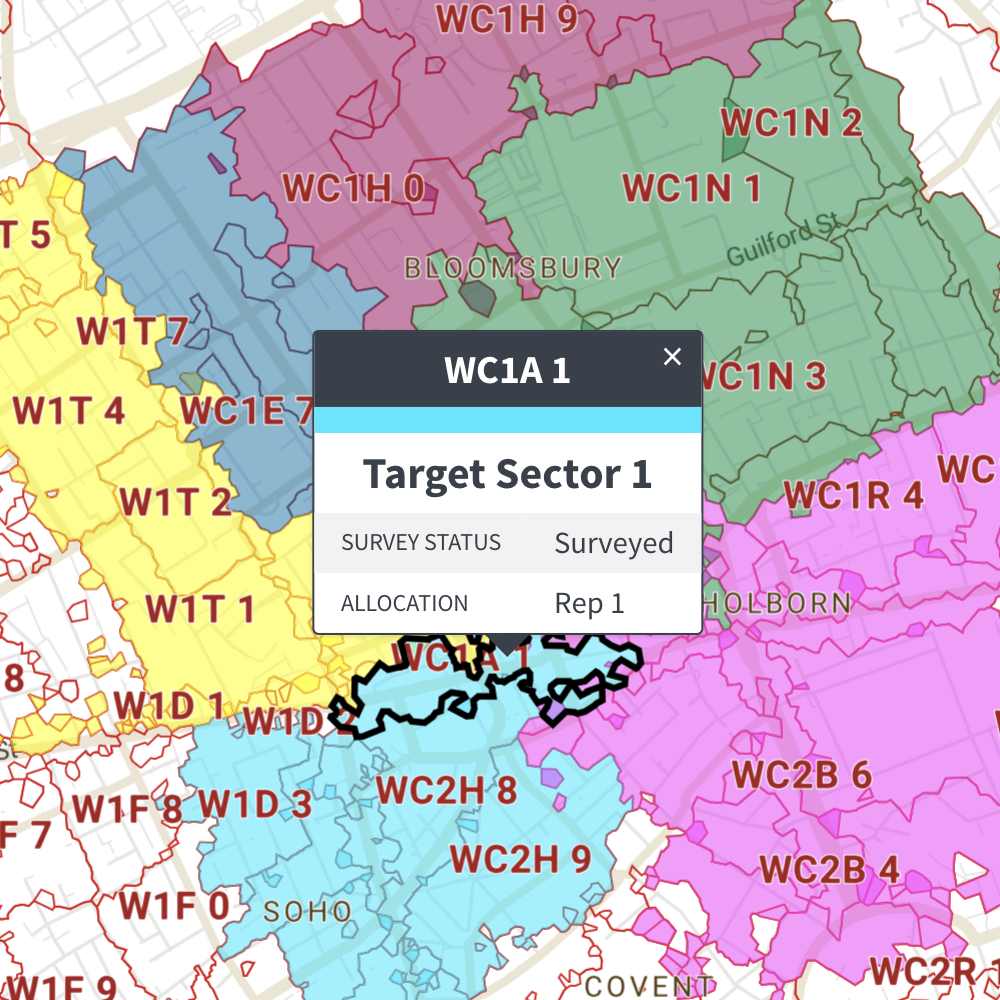
- Postcode Sectors
- Ceremonial Counties
- Counties and Unitary Authorities
- Local Authorities
See a live example of a postcode district polygons map connected to a spreadsheet and learn more about mapping from spreadsheets.