All customers get access to these online postcode reference maps
Multi-layer postcodes
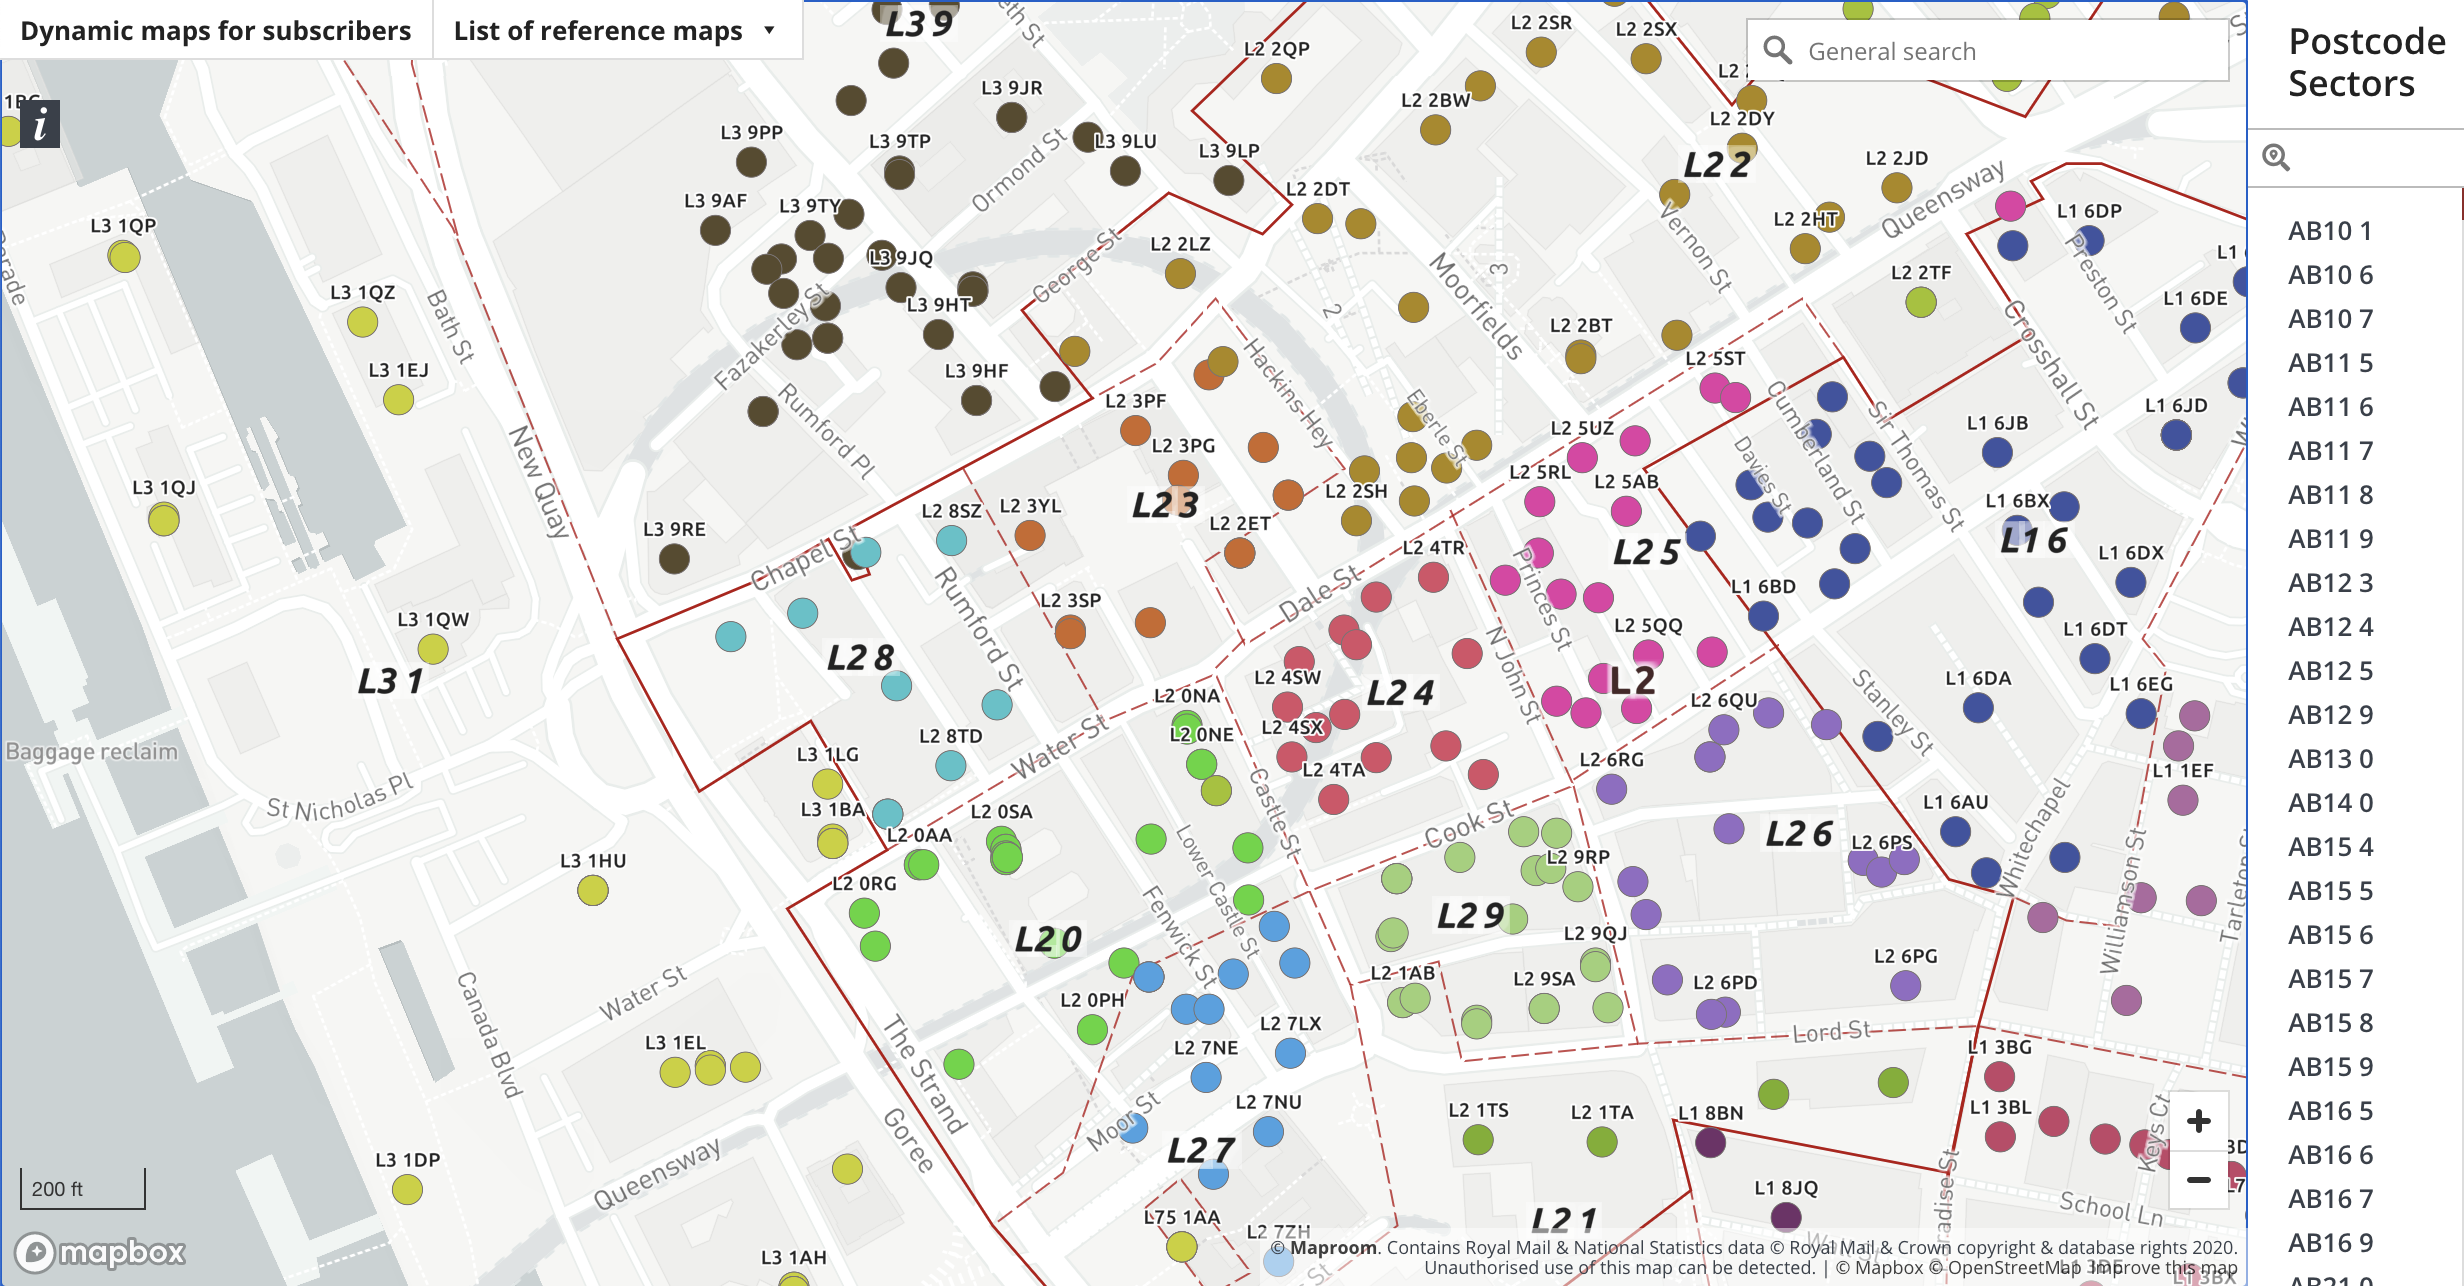
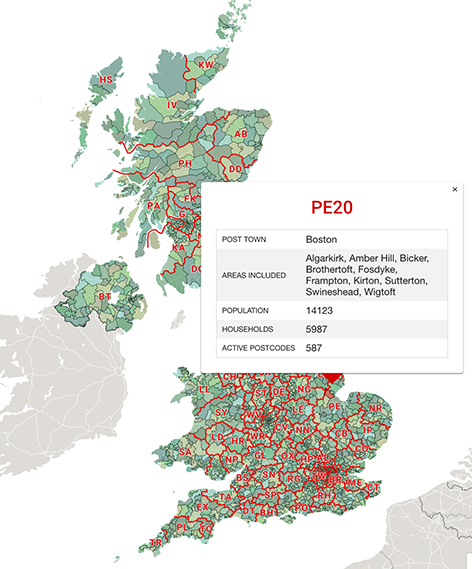
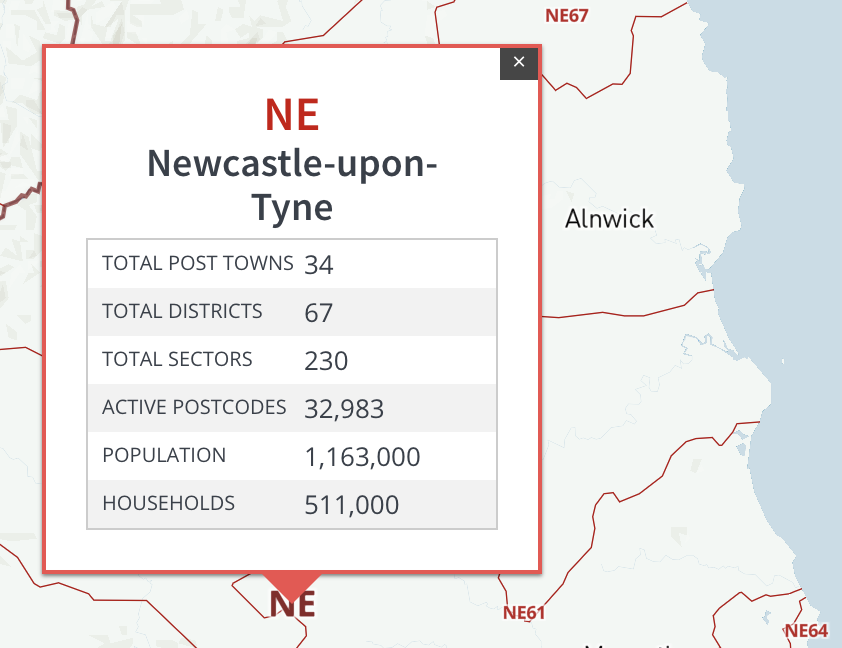
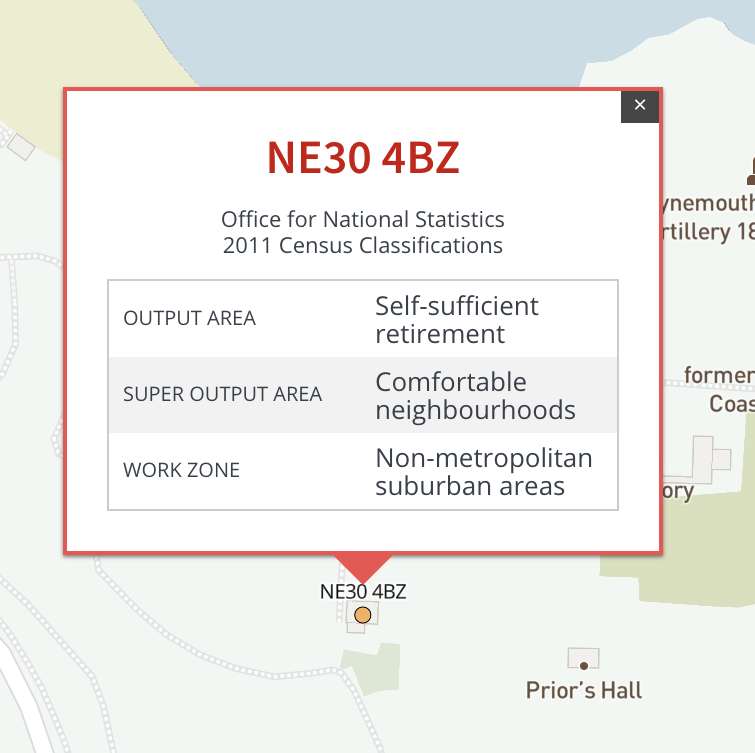
These brilliant deep-zoom maps have every postcode in the UK in context with roads and buildings. Popup info-boxes give a summary of postcode areas including population and number of households. At street level, all 1.7 million postcode centroid points are interactive, showing ONS census classifications. This data is typically used in business intelligence.
Maps that highlight postcode units at area, district and sector levels
There are many times when people working with postcodes need to see the geographic shape of an area, district or sector AND the individual postcode units within that level. Our maps show the unit centroids according to the level that’s relevant to the viewer. They are great visual aids, especially at sector level, where sectors are often bitty – like an archipelago of islands scattered among other sectors. These maps help where polygons alone can look confusing or fail to show the whole picture of postcode distribution, such as when different sectors occupy different portions of a building.
Population and census data
Postcodes juxtaposed with UK local government boundaries
Postcodes are often related to but not coterminous with the boundaries of counties, and unitary and local authorities. We have dynamic maps layered with postcodes and other administrative boundaries giving the crucial information as well as visual aids for complicated mapping tasks that are quite literally impossible with paper maps.